Figures & data
Table 1. Drug half-lives and approximate urine detection periods.
Figure 1. Cocaine and Opiate use profile. Following urine concentrations can show new drug use occurred.
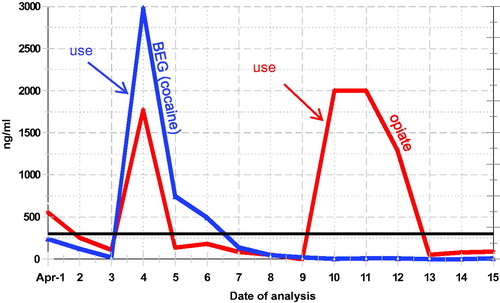
Figure 2. Urine specific gravity vs Urine creatinine. Numerous urine creatinine concentrations are possible for every specific gravity value, suggesting urine creatinine is a better marker of dilution.
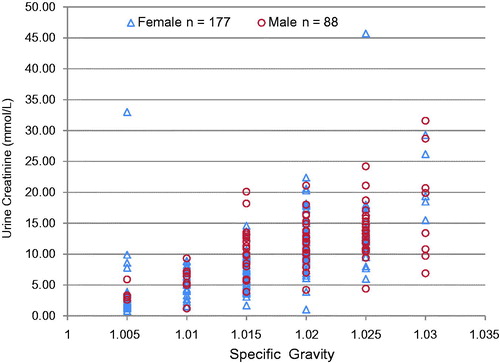
Table 2. Descriptive statistics for urine reference ranges.
Figure 3. Urine EDDP (methadone metabolite) profile. EDDP excretion window is at “steady state” in patients on chronic dosing. Non-adherence or problem samples can be identified. UCr does not add value to interpretation.
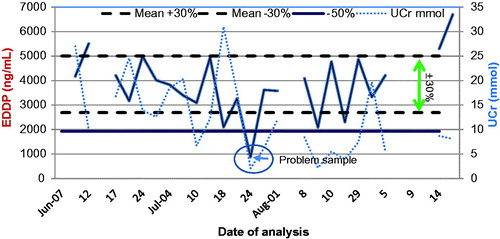
Figure 4. Alcohol blood and urine profile. The blood alcohol concentration and urine alcohol concentration curves are displaced in time as there is time lag in the production and diffusion of alcohol into the bladder.
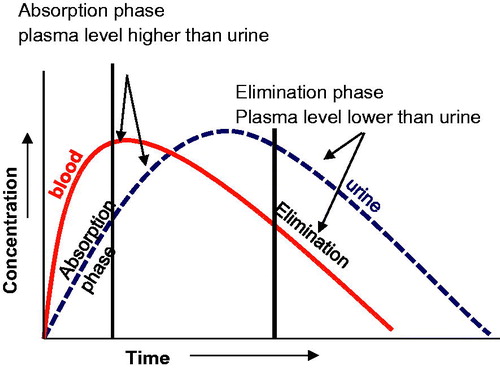
Table 3. Urine glucose stability in a diabetic patient NOT drinking alcohol.
Table 4. Urine glucose stability in a diabetic patient who has been drinking alcohol.
Figure 5. Cocaine metabolism. All chemical formulas are from their respective pages in Wikipedia.
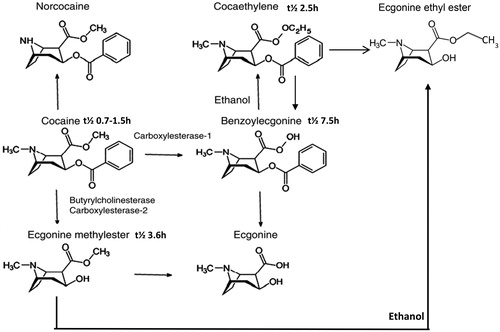
Figure 6. Opiate metabolism. All chemical formulas are from their respective pages in Wikipedia.
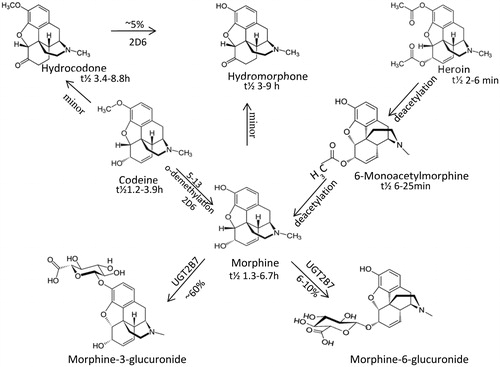
Table 5. Effect of urine pH on methadone excretion.
Figure 7. Calculation of methadone half life. In a once a day (24 h) dosing. C4h (C post peak) must be measured 4 or more hours after last dose to ensure drug distribution has taken place.
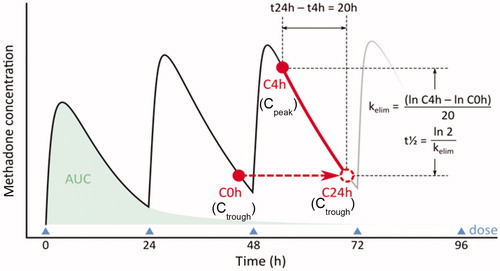
Figure 8. Urine EDDP (methadone metabolite) and change in methadone dose. Urine EDDP concentrations fall in tandem with decreasing methadone dose.
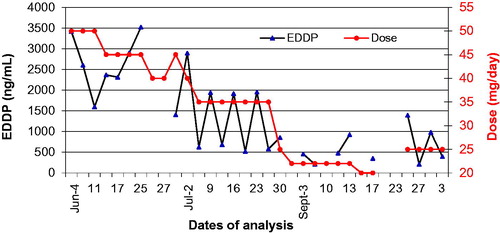
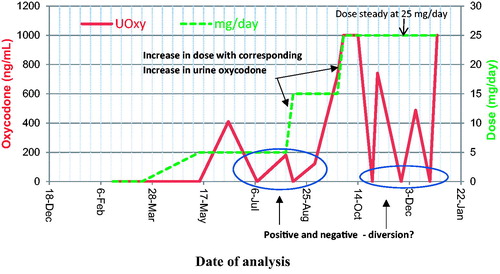
Figure 9. Oxycodone dose and urine EIA profile. Although oxycodone dose (mg/day) is increasing, oxycodone (ng/mL) concentrations are inconsistent with dose change. Following urinary ng/mL can show non-adherence to dose changes.