Figures & data
Figure 1. The chemical structure of vitamin B12.
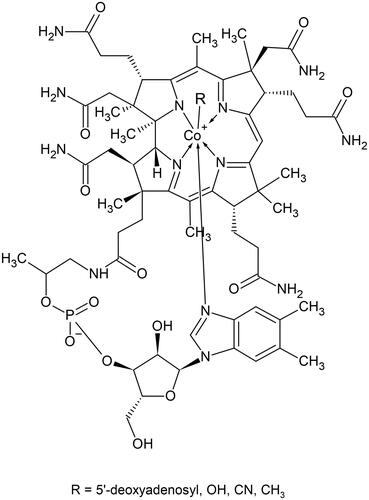
Figure 2. Vitamin B12 absorption and intracellular processing via two enzymatic pathways. In the absence of vitamin B12, 5-MTHF becomes metabolically trapped in this form producing a pseudo folate-deficient state (methyl-trap) and cannot be utilized for regeneration of THF. Cbl: cobalamin; CBS: cystathionine beta-synthase; dTMP: deoxythymidine monophosphate; dUMP: deoxyuridine monophosphate; DHFR: dihydrofolate reductase; HC: haptocorrin; holoTC: holotranscobalamin; HO-Cbl: hydroxocobalamin; IF: intrinsic factor; MS: methionine synthase; Me-Cbl: methylcobalamin; MTHFR: methylene tetrahydrofolate reductase; MMA: methylmalonic acid; MCM: methylmalonyl-CoA mutase; 5-MTHF: 5-methyltetrahydrofolate; SAH: S-Adenosyl homocysteine; SAM: S-Adenosyl methionine; THF: tetrahydrofolate; TS: thymidylate synthase; TC: transcobalamin.
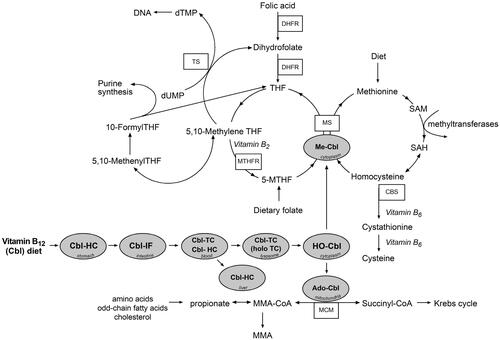
Figure 3. Relationship between the intake and percentage of absorbed B12 from a dose of [58Co]-cyanocobalamin (Adams et al. [Citation34]) and [13C]-cyanocobalamin (Devi et al. [Citation35]) in n = 10–12 healthy volunteers.
![Figure 3. Relationship between the intake and percentage of absorbed B12 from a dose of [58Co]-cyanocobalamin (Adams et al. [Citation34]) and [13C]-cyanocobalamin (Devi et al. [Citation35]) in n = 10–12 healthy volunteers.](/cms/asset/da5da3de-aa68-4441-a214-46cd3ac80f35/ilab_a_1885339_f0003_b.jpg)
Figure 4. The correlation between holoTC and serum B12 in the low holoTC range, <25 pmol/L. The horizontal line on the y-axis represents the serum B12 deficiency cutoff of 138 pmol/L used in the authors’ laboratory (AS-M and DJH).
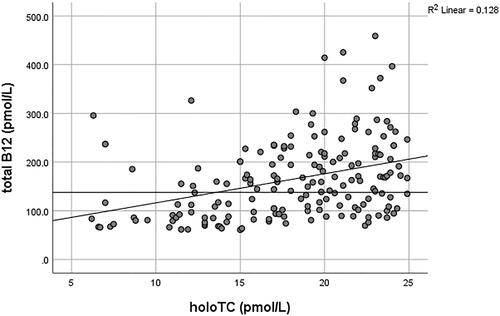
Figure 5. The correlation between holoTC and serum B12 in the holoTC range ≥25 pmol/L. The horizontal line on the y-axis represents the serum B12 deficiency cutoff of 138 pmol/L and the vertical line represents the holoTC cutoff of 70 pmol/L for B12 replete patients as used in authors’ laboratory (AS-M and DJH). Samples with holoTC results between 25–70 pmol/L are referred for additional testing.
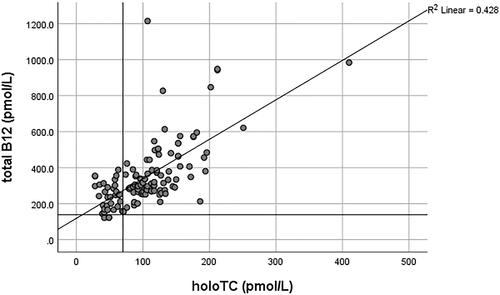
Table 1. The commonly seen vitamin B12 marker patterns in selected clinical scenarios.
Table 2. Selected serum/plasma results from longitudinal studies of uncomplicated pregnancies: pre-conception, pregnancy, labor, post-delivery and cord samples.
Figure 6. Empty nitrous oxide canisters in a London residential street, February 2020.