6,086
Views
1
CrossRef citations to date
0
Altmetric
Invited Reviews

Screening and diagnosis of inherited platelet disorders

ORCID Icon, ORCID Icon & ORCID Icon
Pages 405-444 | Received 08 Dec 2021, Accepted 01 Mar 2022, Published online: 28 Mar 2022

Figures & data

Figure 1. Causes of platelet function disorders and inherited thrombocytopenias. The figure summarizes the genes and pathways that contribute to the pathogenesis of platelet disorders, which includes regulatory genes that have impacts on the early or later stages of megakaryopoiesis, as summarized in Lentaigne et al. [Citation13].

Figure 1. Causes of platelet function disorders and inherited thrombocytopenias. The figure summarizes the genes and pathways that contribute to the pathogenesis of platelet disorders, which includes regulatory genes that have impacts on the early or later stages of megakaryopoiesis, as summarized in Lentaigne et al. [Citation13].

Table 1. Overview of different inherited thrombocytopenias.

Table 2. Overview of inherited platelet function disorders associated with a normal platelet count. The conditions listed have a normal platelet size.

Table 3. Likelihood of experiencing bleeding for commonly encountered platelet function disorders.

Table 4. Likelihood of a bleeding disorder based on findings for different platelet function disorder tests [Citation9,Citation24,Citation141,Citation144].

Figure 2. Light transmission platelet aggregation findings for a control subject. The aggregation tracing illustrates that there is significant aggregation with all agonists, except with the lower concentration of ristocetin, which is expected. The maximal aggregation with each agonist falls within the reference interval. See for the reference interval for each agonist.

Figure 2. Light transmission platelet aggregation findings for a control subject. The aggregation tracing illustrates that there is significant aggregation with all agonists, except with the lower concentration of ristocetin, which is expected. The maximal aggregation with each agonist falls within the reference interval. See Table 6 for the reference interval for each agonist.

Figure 3. von Willebrand factor loss-of-function and gain-of-function defects, evaluated by light transmission platelet aggregometry. Panel (A) illustrates ristocetin-induced platelet aggregation findings for a person with type 2A von Willebrand disease, who had delayed aggregation with ristocetin due to their loss-of-function defect. The maximal aggregation attained was within the reference interval, despite the delayed response. Panel (B) illustrates the findings for a person with type 2B von Willebrand disease and significant thrombocytopenia, whose gain-of-function defect in von Willebrand factor resulted in increased aggregation with the lower concentration of ristocetin. The responses to other agonists were within the expected range for a platelet rich plasma sample with a very low platelet count. See for maximal aggregation data.

Figure 3. von Willebrand factor loss-of-function and gain-of-function defects, evaluated by light transmission platelet aggregometry. Panel (A) illustrates ristocetin-induced platelet aggregation findings for a person with type 2A von Willebrand disease, who had delayed aggregation with ristocetin due to their loss-of-function defect. The maximal aggregation attained was within the reference interval, despite the delayed response. Panel (B) illustrates the findings for a person with type 2B von Willebrand disease and significant thrombocytopenia, whose gain-of-function defect in von Willebrand factor resulted in increased aggregation with the lower concentration of ristocetin. The responses to other agonists were within the expected range for a platelet rich plasma sample with a very low platelet count. See Table 6 for maximal aggregation data.

Figure 4. Aggregation findings for Bernard-Soulier syndrome. There is no agglutination or aggregation evident with ristocetin, whereas the responses to other agonists are within the expected range. See for maximal aggregation data.

Figure 4. Aggregation findings for Bernard-Soulier syndrome. There is no agglutination or aggregation evident with ristocetin, whereas the responses to other agonists are within the expected range. See Table 6 for maximal aggregation data.

Figure 5. Aggregation findings for Quebec platelet disorder. There is reduced primary aggregation and no secondary aggregation with epinephrine, which is a hallmark feature of the disorder. This subject also had reduced maximal aggregation, and deaggregation, with thromboxane analogue U46619 as an incidental finding. See for maximal aggregation data.

Figure 5. Aggregation findings for Quebec platelet disorder. There is reduced primary aggregation and no secondary aggregation with epinephrine, which is a hallmark feature of the disorder. This subject also had reduced maximal aggregation, and deaggregation, with thromboxane analogue U46619 as an incidental finding. See Table 6 for maximal aggregation data.

Figure 6. Aggregation findings for Glanzmann thrombasthenia. A response is evident with ristocetin but there is no response, apart from shape change, with other agonists. With ristocetin, the maximal response achieved is reduced, reflecting that there is agglutination but no aggregation. See for maximal aggregation data.

Figure 6. Aggregation findings for Glanzmann thrombasthenia. A response is evident with ristocetin but there is no response, apart from shape change, with other agonists. With ristocetin, the maximal response achieved is reduced, reflecting that there is agglutination but no aggregation. See Table 6 for maximal aggregation data.

Figure 7. Example of aggregation findings for δ-granule deficiency. Findings are shown for representative subject with confirmed platelet δ-granule deficiency (average: 1.2 δ-granules/platelet; reference interval: 4.9–10.0 δ-granules/platelet). Aggregation findings in this disorder can range from non-diagnostic to showing multiple abnormalities, particularly with weak agonists. This person’s maximal aggregation responses were within the reference interval with all agonists except there was a reduced response to the lower concentration of collagen and reduced secondary aggregation with epinephrine. See for maximal aggregation values compared to the reference interval.

Figure 7. Example of aggregation findings for δ-granule deficiency. Findings are shown for representative subject with confirmed platelet δ-granule deficiency (average: 1.2 δ-granules/platelet; reference interval: 4.9–10.0 δ-granules/platelet). Aggregation findings in this disorder can range from non-diagnostic to showing multiple abnormalities, particularly with weak agonists. This person’s maximal aggregation responses were within the reference interval with all agonists except there was a reduced response to the lower concentration of collagen and reduced secondary aggregation with epinephrine. See Table 6 for maximal aggregation values compared to the reference interval.

Figure 8. Examples of aggregation abnormalities with multiple agonists due to RUNX1 haploinsufficiency and unknown causes. Panel (A) shows the findings for a person with RUNX1 haploinsufficiency and mild thrombocytopenia, who had reduced aggregation with collagen and thromboxane analogue U46619, shared with other affected family members (not shown), who also had reduced maximal aggregation with arachidonic acid. Panel B shows the findings for an individual from a family with an autosomal dominant platelet disorder of unknown molecular cause, who had abnormal responses to multiple agonists that were particularly evident with arachidonic acid and thromboxane analogue U46619 as well as lower concentrations of collagen. See for the maximal aggregation data of these subjects.

Figure 8. Examples of aggregation abnormalities with multiple agonists due to RUNX1 haploinsufficiency and unknown causes. Panel (A) shows the findings for a person with RUNX1 haploinsufficiency and mild thrombocytopenia, who had reduced aggregation with collagen and thromboxane analogue U46619, shared with other affected family members (not shown), who also had reduced maximal aggregation with arachidonic acid. Panel B shows the findings for an individual from a family with an autosomal dominant platelet disorder of unknown molecular cause, who had abnormal responses to multiple agonists that were particularly evident with arachidonic acid and thromboxane analogue U46619 as well as lower concentrations of collagen. See Table 6 for the maximal aggregation data of these subjects.

Figure 9. Aggregation abnormalities associated with aspirin or an aspirin-like defect. There is no aggregation with arachidonic acid whereas the aggregation response to thromboxane analogue U46619 is completely normal. Additionally, there is absent secondary aggregation with epinephrine (not shown) and reduced maximal aggregation with the lower concentration of collagen. See for maximal aggregation data.

Figure 9. Aggregation abnormalities associated with aspirin or an aspirin-like defect. There is no aggregation with arachidonic acid whereas the aggregation response to thromboxane analogue U46619 is completely normal. Additionally, there is absent secondary aggregation with epinephrine (not shown) and reduced maximal aggregation with the lower concentration of collagen. See Table 6 for maximal aggregation data.

Table 5. International Society on Thrombosis and Haemostasis recommended investigations for suspected inherited platelet function disorders.

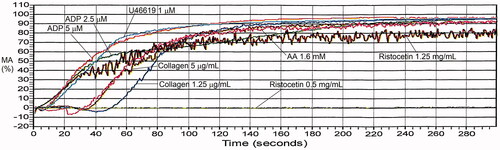
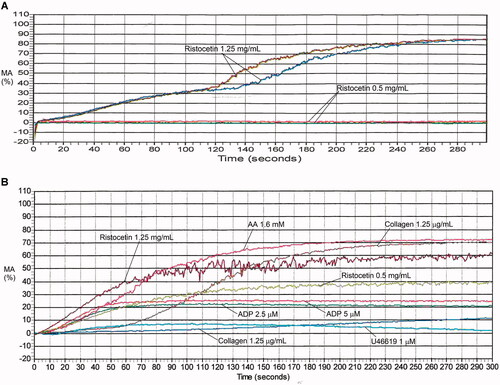
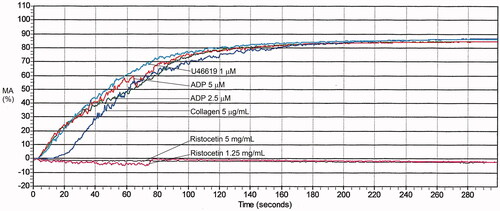
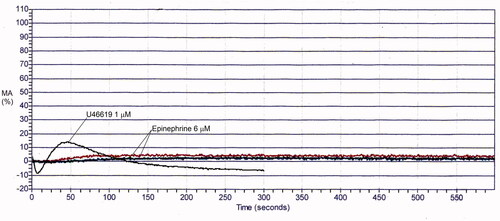
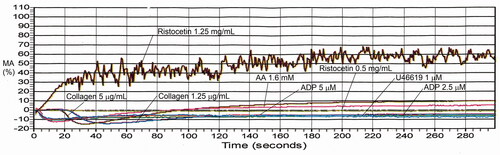
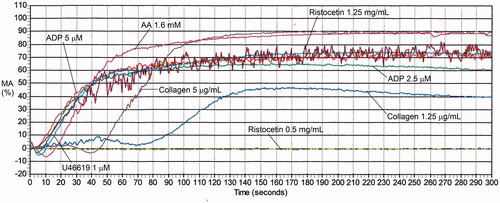
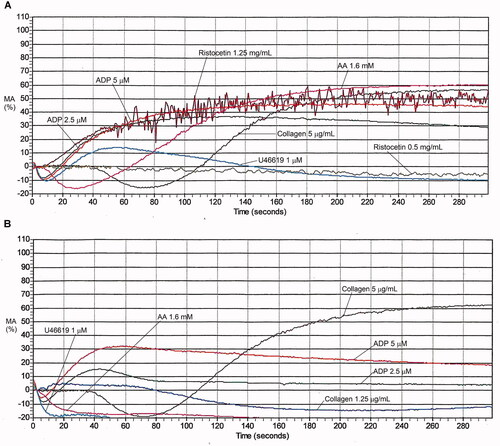
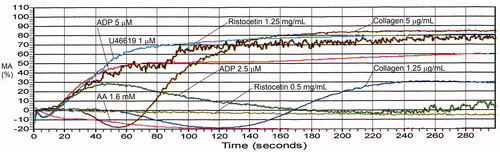
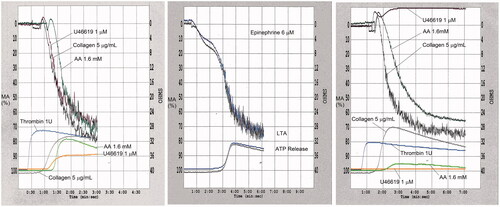
Table 6. Maximal aggregation findings for representative cases with platelet function disorders, evaluated by light transmission platelet aggregometry.

Table 7. International recommendations on preanalytical variables for platelet aggregation studies by light transmission aggregometry.

Table 8. International recommendations on analytical variables for platelet aggregation studies by light transmission aggregometry.

Table 9. Summary of recommended agonists for platelet aggregation studies by different international guidelines.

Table 10. Approach to interpreting platelet aggregation studies by light transmission aggregometry. The approach has been updated from published guidance [Citation8].

Figure 10. Examples of normal and abnormal lumiaggregometry findings. Each tracing show simultaneous evaluation of light transmission platelet aggregation (upper part of each tracing) and ATP release (lower part of each tracing), evaluated by lumiaggregometry. In panel (A), the ATP release with strong agonists (e.g. collagen), begins at the same time as aggregation. In panel (B), the ATP release with epinephrine, which is a weak agonist, is delayed until the start of secondary aggregation. In panel (C), there are several abnormal findings: aggregation and ATP release are absent with thromboxane analogue and aggregation and ATP release are reduced with arachidonic acid. Panels (A,C) also show the normal, rapid ATP release with thrombin (aggregation was not monitored as thrombin clots the sample).

Figure 10. Examples of normal and abnormal lumiaggregometry findings. Each tracing show simultaneous evaluation of light transmission platelet aggregation (upper part of each tracing) and ATP release (lower part of each tracing), evaluated by lumiaggregometry. In panel (A), the ATP release with strong agonists (e.g. collagen), begins at the same time as aggregation. In panel (B), the ATP release with epinephrine, which is a weak agonist, is delayed until the start of secondary aggregation. In panel (C), there are several abnormal findings: aggregation and ATP release are absent with thromboxane analogue and aggregation and ATP release are reduced with arachidonic acid. Panels (A,C) also show the normal, rapid ATP release with thrombin (aggregation was not monitored as thrombin clots the sample).

Figure 11. Transmission electron microscopy images of whole platelets in whole mount preparations of control and δ-granule deficient (DGD) samples. The image from the control platelet (left) shows numerous electron dense structures and the majority of these structures have smooth contours and a uniform electron density, which is typical of δ-granules. The platelet from the δ-granule deficient subject contains only one electron dense granule, consistent with their low δ-granule count and confirmed δ-granule deficiency.

Figure 11. Transmission electron microscopy images of whole platelets in whole mount preparations of control and δ-granule deficient (DGD) samples. The image from the control platelet (left) shows numerous electron dense structures and the majority of these structures have smooth contours and a uniform electron density, which is typical of δ-granules. The platelet from the δ-granule deficient subject contains only one electron dense granule, consistent with their low δ-granule count and confirmed δ-granule deficiency.

Figure 12. Thrombograms compare platelet rich plasma thrombin generation profiles for representative control and platelet function disorder subjects. The control sample generated more thrombin than the samples from the subjects with confirmed Quebec platelet disorder (QPD) or a familial platelet function disorder due to RUNX1 haploinsufficiency (RUNX1). The defects in these platelet function disorders include impairments in the ability of platelets to support thrombin generation.

Figure 12. Thrombograms compare platelet rich plasma thrombin generation profiles for representative control and platelet function disorder subjects. The control sample generated more thrombin than the samples from the subjects with confirmed Quebec platelet disorder (QPD) or a familial platelet function disorder due to RUNX1 haploinsufficiency (RUNX1). The defects in these platelet function disorders include impairments in the ability of platelets to support thrombin generation.

Figure 13. Examples of flow cytometry analysis to confirm the glycoprotein deficiencies for cases with Glanzmann thrombasthenia (GT) and Bernard-Soulier syndrome (BSS). The panels compare the relative mean fluorescent intensity (MFI) from flow cytometry analysis of control compared to patient samples, evaluated with fluorescent antibodies to the platelet glycoprotein (GP) receptor αIIbβ3 that is deficient in GT (upper panel) and to the GPIbα and GPIX components of the platelet GPIb/IX/V complex that is deficient in BSS (lower panel).

Figure 13. Examples of flow cytometry analysis to confirm the glycoprotein deficiencies for cases with Glanzmann thrombasthenia (GT) and Bernard-Soulier syndrome (BSS). The panels compare the relative mean fluorescent intensity (MFI) from flow cytometry analysis of control compared to patient samples, evaluated with fluorescent antibodies to the platelet glycoprotein (GP) receptor αIIbβ3 that is deficient in GT (upper panel) and to the GPIbα and GPIX components of the platelet GPIb/IX/V complex that is deficient in BSS (lower panel).

Table 11. Summary of key consensus recommendations from the International Society on Thrombosis and Haemostasis on using flow cytometry for the assessment of disorders of platelet number and function [Citation311].