Figures & data
Figure 1. Common research steps on urinary proteomics. The first stage is to identify candidate biomarkers via proteomics analysis. When differentially expressed proteins are screened, candidate biomarkers in the validation group can be targeted. After identifying biomarkers, functional analysis of specific proteins can be carried out.
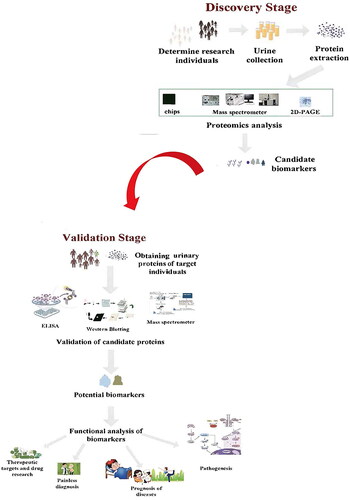
Figure 2. The current widely accepted pathogenesis and pathological characteristics of several glomerular diseases. (a) The popular theory of “four blows” on the pathogenesis of IgA: hit 1, production of galactose-deficient lgA1; hit 2, production of anti-galactose-deficient lgA1 autoantibodies; hit 3, immune complex formation and deposition; hit 4, deposition of immune complexes in the mesangial area, activating the complement system and causing glomerular damage. (b) Depiction of immune complexes deposited under the epithelial cells of GBM, resulting in its thickening and podocyte injury, which could damage the barrier of glomerular filtration and cause further proteinuria. (c) Depiction of glomerular changes in patients with MCD and FSGS. The glomerular lesion of the former is mild, while that of the latter shows local sclerosis. GBM: glomerular basement membrane.
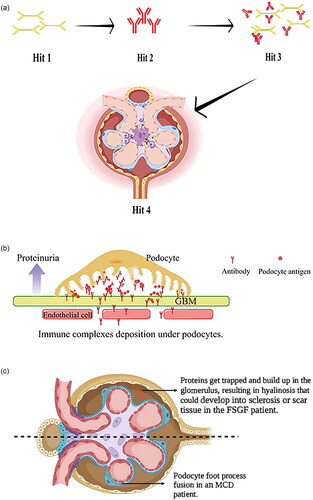
Figure 3. Pathological features of different glomerular diseases. (a) Immunofluorescence microscopy in a patient with IgA shows IgA deposition along the mesangial area (original magnification, 200×). (b) Glomerulus from a patient with idiopathic membranous nephropathy shows the thickened GBM stained with PASM (arrow) under a light microscope. (c) HE staining shows mild glomerular lesions and mild mesangial hyperplasia (arrow) from a patient with MCD. (d) The glomeruli with segmental sclerosis (arrow) are shown via PAS staining in a patient with FSGS. These images were provided by the Department of Nephrology of Shengjing Hospital. HE: hematoxylin-eosin; PAS: Schiff periodic acid; PASM: periodic acid-silver metheramine.
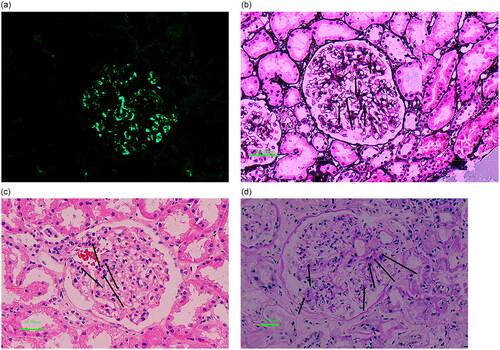
Table 1. Summary of research progress on urinary proteomics of glomerular disease.
Table 2. Summary of research on urinary protein biomarkers of glomerular diseases.
Figure 4. GO and KEGG enrichment analysis. Bar graph of enriched terms across input gene lists (colored according to p-values). (a) Enrichment analysis results of GO molecular functions. (b) Enrichment analysis results of GO biological process. (c) Enrichment analysis results of GO cellular components. (d) Enrichment analysis results of KEGG pathways. Adjusted p-value <0.05 was considered significant.
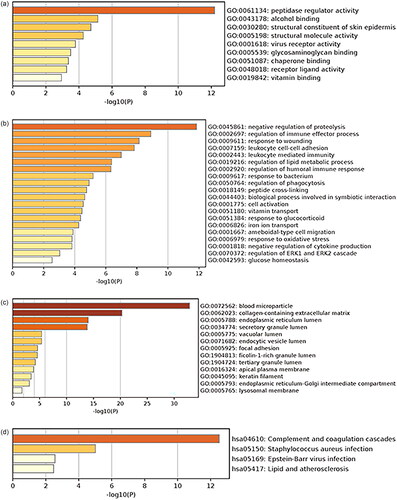
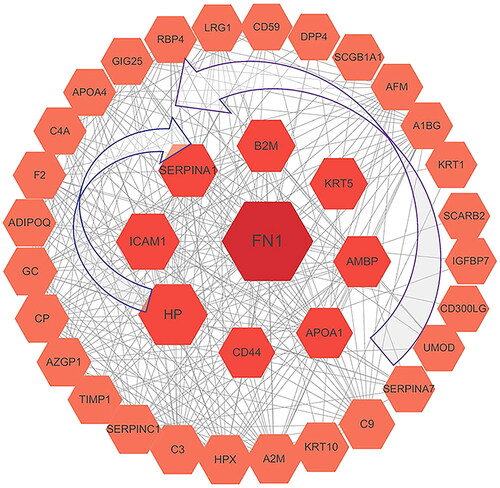
Figure 5. PPI network diagram of candidate biomarkers. Excluding four proteins without segment connections, the PPI network diagram includes 37 DEPs. At the outermost part of the concentric circle, the BC value that represents the centrality of a protein increases counterclockwise from SERPINA7, while decreasing clockwise from HP for the middle circle. The PPI enrichment p-value was lower than 1.0e−16 in STRING. The number of edges on a protein is proportional to its the connectivity with other proteins in the network. The BC was selected to represent the importance of differentially expressed proteins. The higher BC values correlate with stronger centrality of these proteins and consequently with more protein cross interactions through the relevant mediations. The size of the circle and the font size reflect the BC value, with bigger circles and fonts corresponding to higher betweenness values. BC: betweenness centrality