Figures & data
Figure 1. Ideal carrageenan structures. Figure from Jiao et al. (Citation2011), an open access article distributed under the Creative Commons Attribution License (CC BY 3.0).
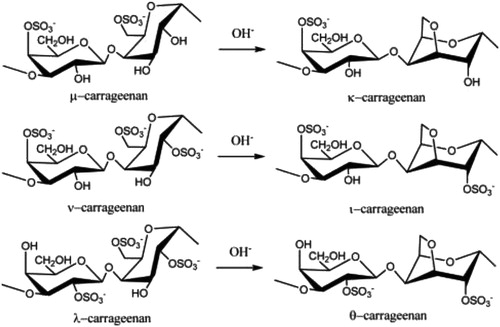
Table 1. Comparison of chemical / physical and toxicological properties of poligeenan and carrageenan.
Figure 2. Changes in Gastric pH Before and After a Meal. Figure used with permission from Kong and Singh (Citation2008) and originally published in Malagelada et al. (Citation1976).
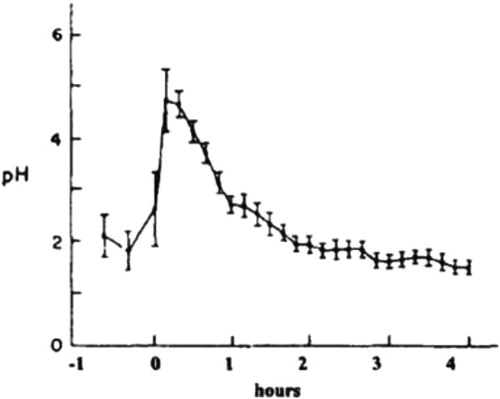
Figure 3. Molecular weight profiles of poligeenan and carrageenan, two distinct polydisperse
substances. Carrageenan is synthesized by red seaweed and displays the common characteristic of polydispersity, which is seen with many hydrocolloid molecules. Poligeenan can only be formed when carrageenan is subjected to harsh acid hydrolysis under laboratory conditions. In order to understand the molecular weight of a polymer it is subjected to size exclusion chromatography (SEC). The instrument compares the weight fraction per change in Log Mw (Y-axis) to the Log of the molecular weight of each fraction. Each molecular weight fraction produces a signal proportional to its concentration. The graph depicts the molecular weight (MW) profiles of both carrageenan and poligeenan. Both CGN and PGN profiles are made up of molecules of various sizes (polydispersity). Polydisperse molecules are often described by their weight average molecular weight (Mw). The vertical arrows show the accepted Mw range for poligeenan (PGN) (10,000 – 20,000 Da.), degraded carrageenan (d-CGN) (20,000 – 40,000 Da.), and CGN (200,000 – 800,000 Da.). Note that the Mw for poligeenan and d-CGN are both clearly part of the poligeenan molecular weight profile and both are formed by harsh acid hydrolysis in the laboratory, also known as the “poligeenan process.” In the example sample above the Mw for PGN is 19,000 Da. and the Mw for the CGN 707,000 Da. Mw requires that you know the fraction of the total weight represented by each individual molecular size. The total mass of each molecule in a sample is NiMi. To get the weight contribution as a fraction of the whole sample, each NiMi is divided by the SNiMi (the sum of all the NiMi values). This fraction is then multiplied by NiMi to yield WiMi. The weight average molecular weight (Mw) for the sample is then the sum of WiMi, where Ni is the number of molecules at any given weight, Mi is the molecular weight of each of those molecules, and Wi is the weight fraction of each type of molecule. See for an example of how to calculate Mn and Mw.
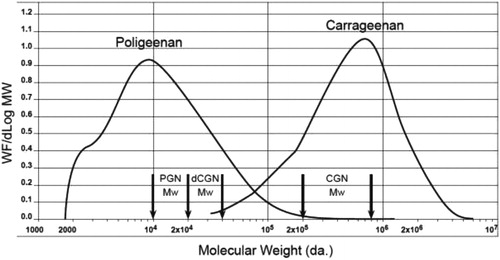
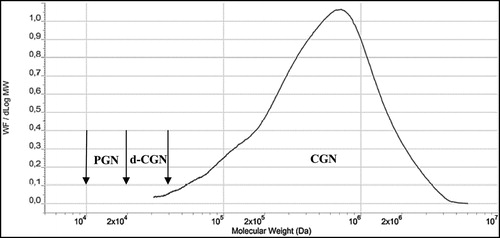
Figure 4. Molecular Weight (Mw) Profile of Typical CGN used in Infant Formulations. (SEC/LS/RI Concentration versus Log Mw). Note the Mw for the CGN sample above is 707,000 Da. Figure used with permission from Blakemore et al. (Citation2014a) and modified.
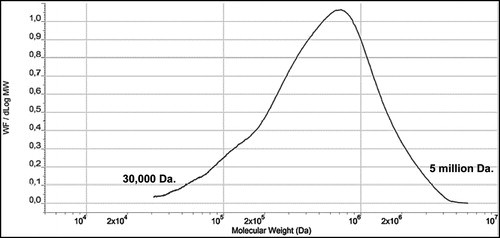
Table 2. Summary of the known gastrointestinal effects of poligeenan in various animal models.
Table 3. A Hypothetical example of how to calculate number average molecular weight (mn) and weight average molecular weight (mw).
Figure 5. Gelation mechanism of kappa-CGN and iota-CGN. Figure used with permission from Blakemore et al. (Citation2014a).
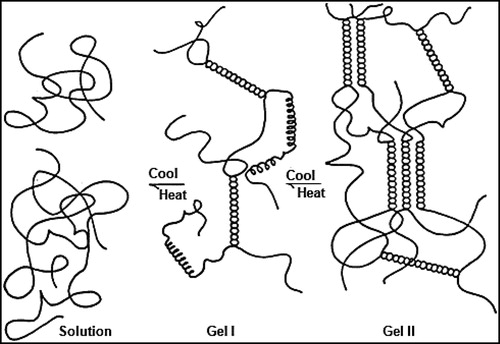
Figure 6. Protein reactivity of kappa-CGN and casein. Figure used with permission from Blakemore et al. (Citation2014a).
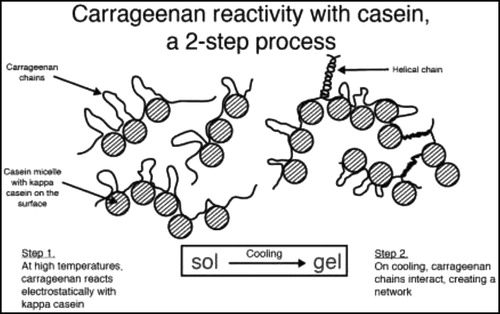
Figure 7. Molecular Weight (Mw) Profile of CGN, poligeenan (PGN) and d-CGN Mw definitions included (Concentration versus Log Mw). The graph above depicts the molecular weight profile of a sample of food grade carrageenan (CGN). Note that poligeenan (PGN) and degraded CGN are not part of the CGN profile. Figure used with permission from Blakemore et al. (Citation2014a) and modified.