Figures & data
Figure 1. PRISMA flow diagram for screening and selection of articles on body selenium status and cardiovascular diseases incidence and mortality.
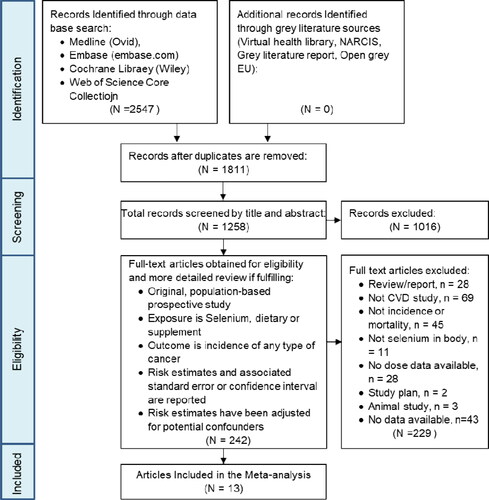
Table 1. Pooled RRs by study designs, sample type, disease, region of study conducted, and dose level of selenium in blood or toenail.
Figure 2. Funnel plot with pseudo 95% confidence limit.
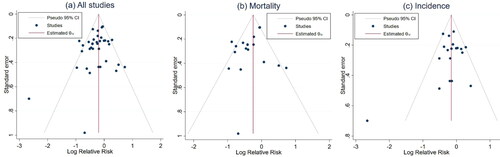
Figure 3. Pooled RRs of the highest concentrations compared to the lowest concentrations of selenium status in the body.
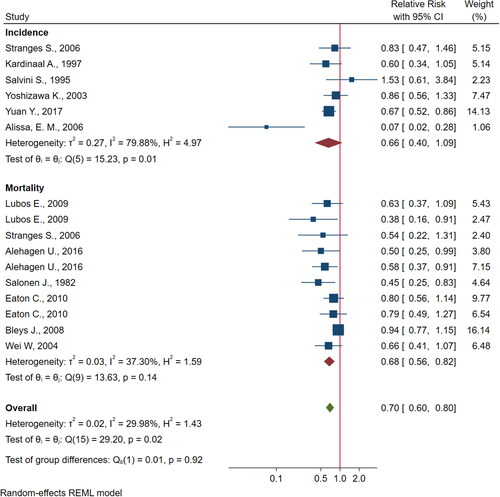
Figure 4. Association between log relative risk of incidence of cardiovascular diseases and increment in blood selenium concentration.
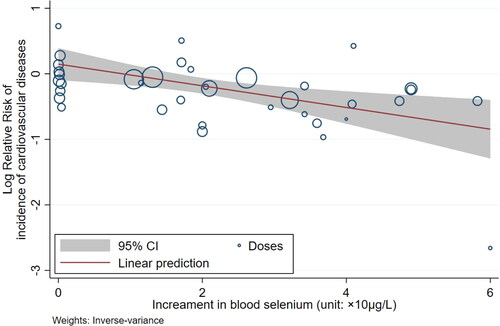
Table 2. Relative risk for mortality and incidence of cardiovascular diseases per unitTable Footnote* increase in selenium concentration.
Figure 5. Association between the relative risk of cardiovascular mortality and increment in blood selenium concentration.
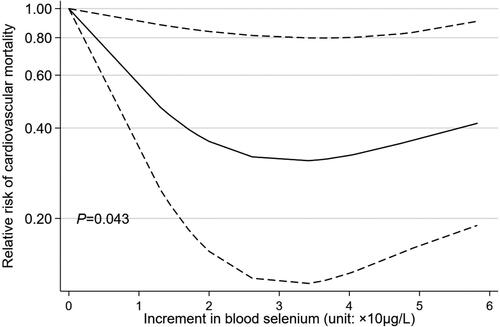
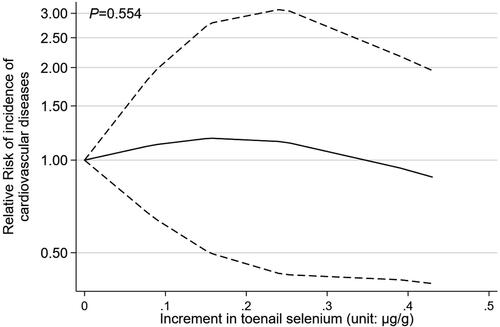
Figure 6. Association between the relative risk of incidence of cardiovascular diseases and increment in toenail selenium concentration.