Figures & data
Figure 1. Per capita supply from maize worldwide and in countries of Eastern and Southern Africa from 4-year average (2010–2013) FAOSTAT data, for consumption (A), energy (B), protein (C) and fat (D).
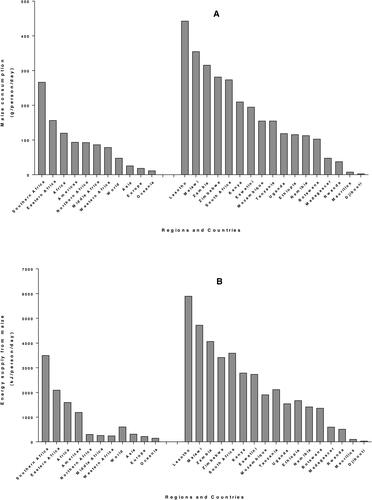
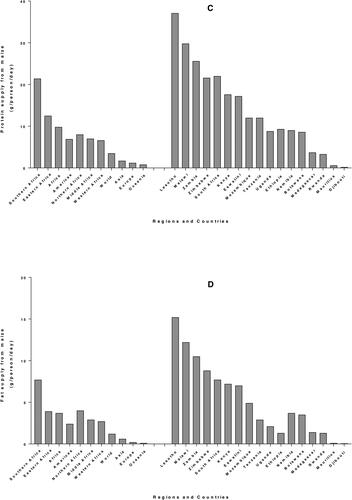
Figure 2. Prevalence of wasting (A), stunting (B) and underweight (C) for children under 5 years in Eastern and Southern Africa. Data from (Akombi et al. Citation2017; FAO Citation2018).
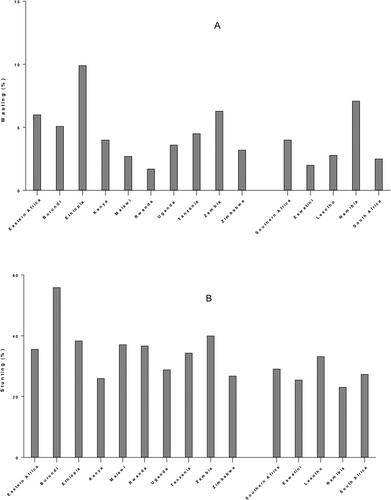
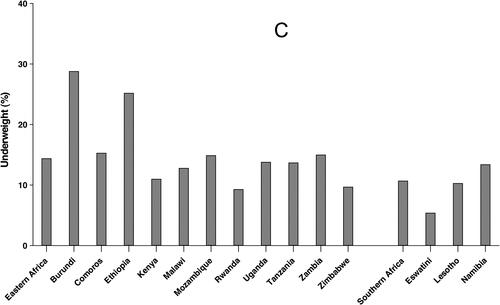
Table 1. Summary of prevalence of children micronutrient deficiencies in Eastern and Southern Africa.
Table 2. Summary of prevalence of Women micronutrient deficiencies in Eastern and Southern Africa.
Figure 3. Comparison of nutrients per 100 g portion of maize with other major staple foods for energy and proximate (A), minerals (B), vitamins (C) and fats (D). For each nutrient, values from USDA database (USDA Citation2020) were normalized with maize value to obtain the relative proportion of nutrient in each staple as compared to maize. *: vitamin C values were divided by 10 for a better fit in the chart.
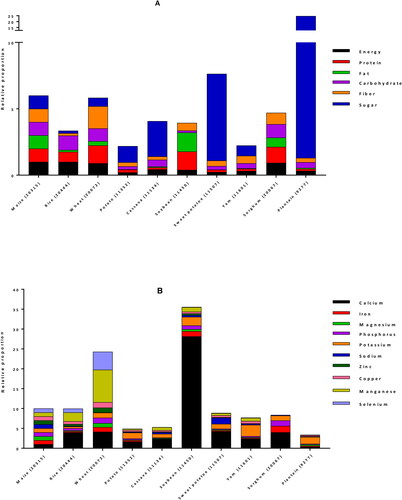
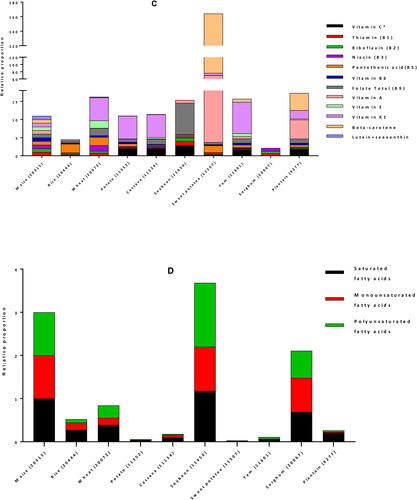
Table 3. Maize-based foods from food composition tables from Eastern and Southern Africa.
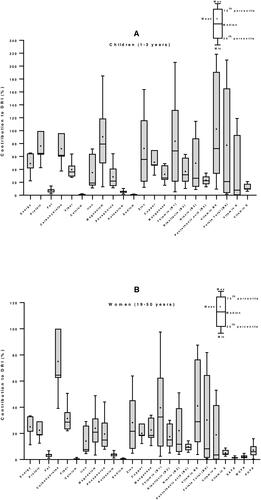
Figure 4. Contribution of 100 g edible portion maize-based foods to dietary reference intakes of energy and nutrients for children (A) and women (B) in Eastern and Southern Africa. Nutritional composition data of 59 maize-based foods were obtained from food composition tables of 8 countries and Dietary Reference Intakes (DRIs) for children (1–3 years) and women (19–50 years) from (Institute of Medicine Citation2006) were used to calculate their percentage of contribution to daily nutrient intake requirement.
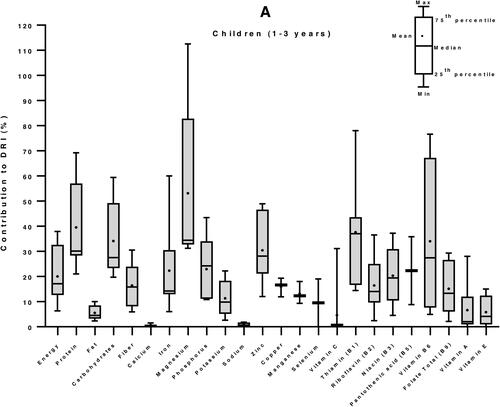
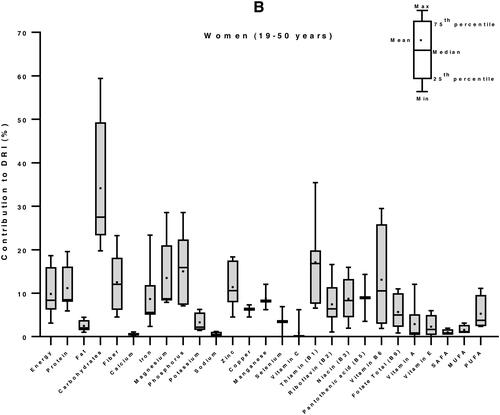
Figure 5. Contribution of maize-based foods to dietary reference intakes of energy and nutrients for children (A) and women (B) in Zambia. Nutritional composition data of 4 maize-based foods were obtained from Zambia Food Composition Tables (National Food and Nutrition Commission Citation2009), then food consumption data from literature and Dietary Reference Intakes (DRIs) for children (1–3 years) and women (19–50 years) from (Institute of Medicine Citation2006) were used to calculate their percentage of contribution to daily nutrient intake requirement.
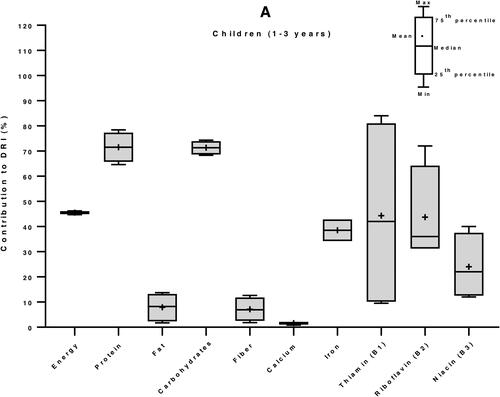
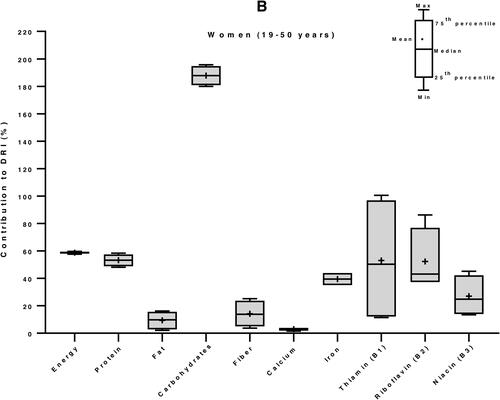
Figure 6. Contribution of maize-based foods to dietary reference intakes of energy and nutrients for children (A) and women (B) in South Africa. Nutritional composition data of 7 maize-based foods were obtained from South Africa Food Composition Tables (SAFOODS Citation2017), then food consumption data from literature and Dietary Reference Intakes (DRIs) for children (1–3 years) and women (19–50 years) from (Institute of Medicine Citation2006) were used to calculate their percentage of contribution to daily nutrient intake requirement.