
Figures & data
Figure 1. Generalized Structures. Note that with reference to β-oxidation the double bond in the ω-phenyl-alkenoic acid 2 is always at C2, the ω-phenyl-hydracrylic acid 3 side-chain hydroxyl is always at C3 whatever the overall side chain length, and n may be zero.
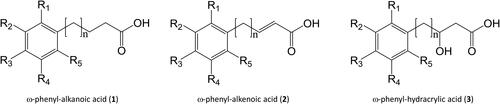
Figure 2. a) Generalized fatty acid β-oxidation scheme occurring in peroxisomes and mitochondria. b) Isomerase can inter-convert cis-3- and trans-2-enoyl-CoAs associated with conventional fatty acids, but it cannot accommodate the trans-2-enoyl-CoA geometric isomer of 3-phenyl-alkenoic acids because the side chain is too short to permit the necessary isomerization.
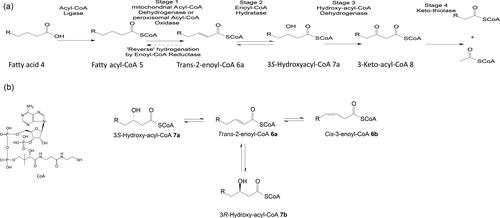
Figure 3. Outline metabolism of unsubstituted ω-phenyl-alkanoic acids.
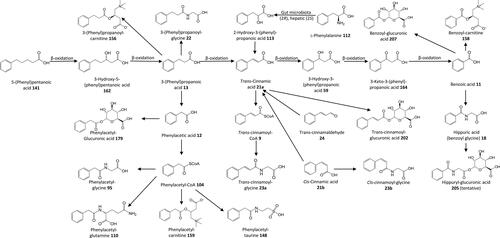
Figure 4. Synthetic ω-phenyl-alkanoic acids used by Dakin.
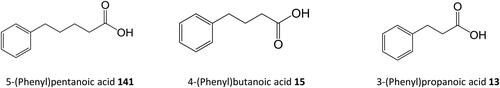
Figure 5. Outline metabolism of C6–C4 ω-phenyl-alkanoic acids.
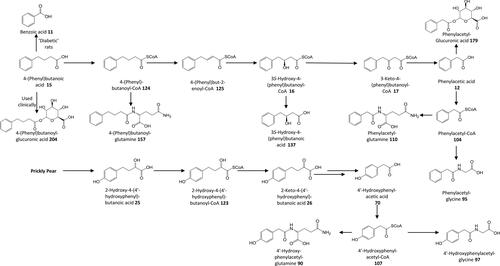
Figure 6. Structures of C6–C3 positional isomers. That on the left is a potential β-oxidation substrate. That on the right is not.
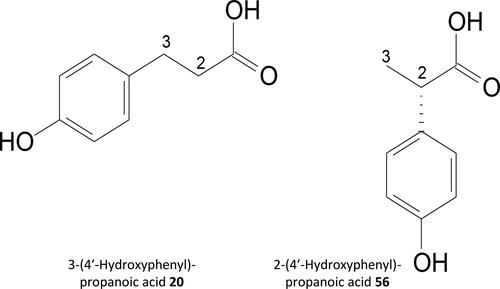
Figure 7. Outline metabolism of [6]-Gingerol by rats. The precise pathways have not been elucidated but appear to be a mixture of ω-, α- and β-oxidation, and phase-2 conjugation.
![Figure 7. Outline metabolism of [6]-Gingerol by rats. The precise pathways have not been elucidated but appear to be a mixture of ω-, α- and β-oxidation, and phase-2 conjugation.](/cms/asset/a70b1e19-cdbf-4441-ae0b-8da1b59adf68/bfsn_a_2131730_f0007_b.jpg)
Figure 8. Outline metabolism of 3′,5′-dihydroxy-ω-phenyl-alkanoic acids.
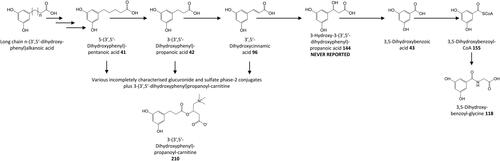
Figure 9. Outline metabolism of 2′-hydroxy-substituted ω-phenyl-alkanoic acids.
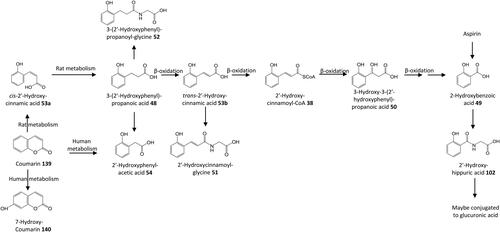
Figure 10. Outline metabolism of 3′-hydroxy-substituted ω-phenyl-alkanoic acids.
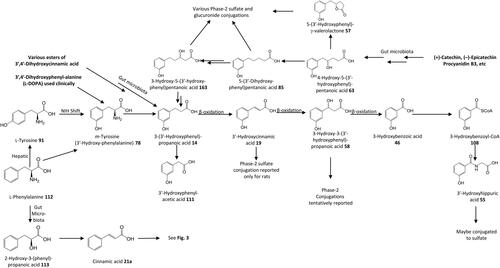
Figure 11. Outline metabolism of 4′-hydroxy-substituted ω-phenyl-alkanoic acids.
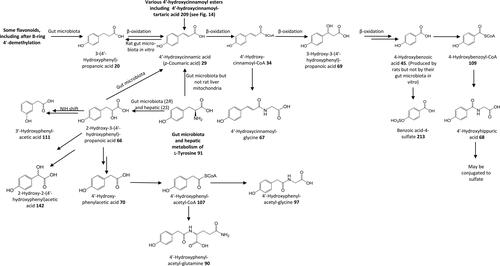
Figure 12. Outline metabolism of n-nonyl-phenol and n-octyl-phenol by Rainbow trout and Mosquitofish.
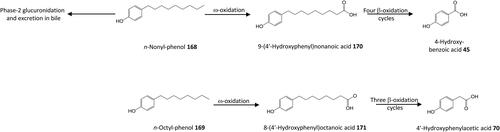
Figure 13. Outline metabolism of 2′-methoxy-substituted ω-phenyl-alkanoic acids.
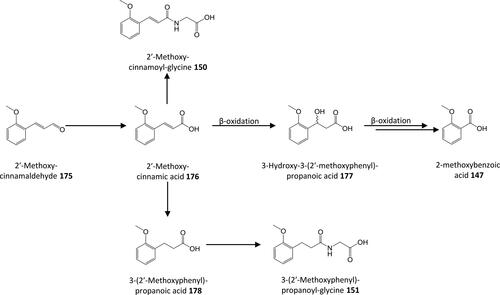
Figure 14. Miscellaneous metabolites.
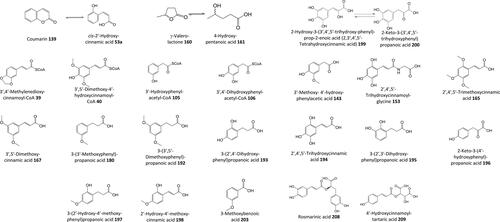
Figure 15. Outline metabolism of 4′-methoxy-substituted ω-phenyl-alkanoic acids.
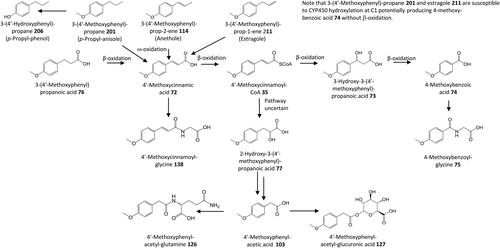
Figure 16. Outline metabolism of 3′,4′-dihydroxy-substituted ω-phenyl-alkanoic acids. For subsequent metabolism of 3′-hydroxyphenyl-substituted metabolites see .
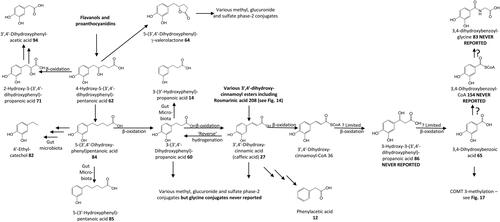
Figure 17. Outline metabolism of 3′-methoxy-4′-hydroxy-substituted ω-phenyl-alkanoic acids.
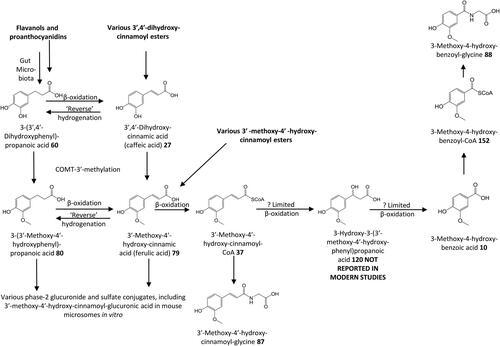
Figure 18. Outline metabolism of 3′-hydroxy-4′-methoxy-substituted ω-phenyl-alkanoic acids.
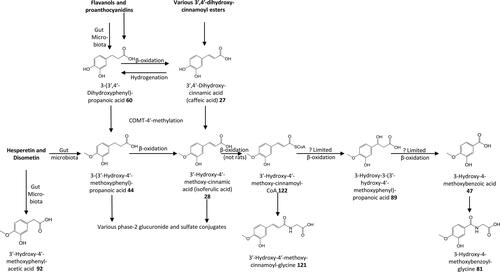
Figure 19. Outline human and rat metabolism of 3′,4′-dimethoxy-ω-phenyl-alkanoic acids.
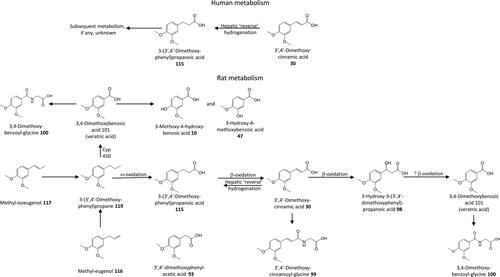
Figure 20. Outline metabolism of 3′,4′,5′-tri-substituted-ω-phenyl-alkanoic acids associated with flavanols.
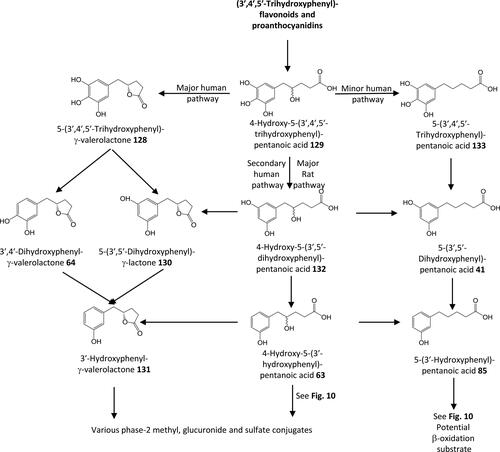
Figure 21. Outline metabolism of 3′,4′-methylenedioxy-substituted-ω-phenyl-alkanoic acids.
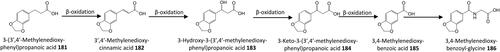
Figure 22. Outline metabolism of preexisting 3′,4′,5′-tri-substituted-ω-phenyl-alkanoic acids.
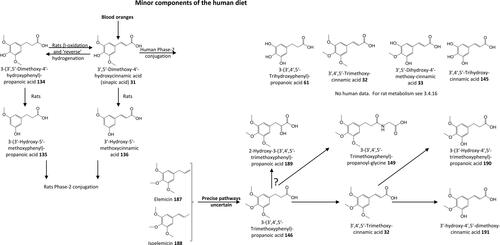
Figure 23. Proposed transformation of 4-hydroxy-5-(phenyl)pentanoic acids to 3-hydroxy-5-(phenyl)pentanoic acid enantiomers.
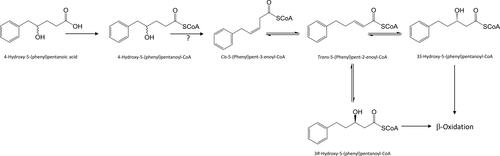
Figure 24. Proposed transformation of 4-hydroxy-5-(phenyl)pentanoic acids to phenylacetic acids.
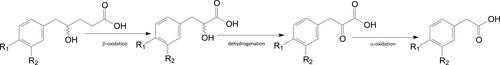
Figure 25. Metabolism of phenolic acids by cytosolic and mitochondrial enzymes. ω-Phenyl-alkanoic and alkenoic acids can be conjugated in the cytosol or can enter mitochondria. The distribution between reactions depends on the chain length and is defined by the individual rate constants (k).
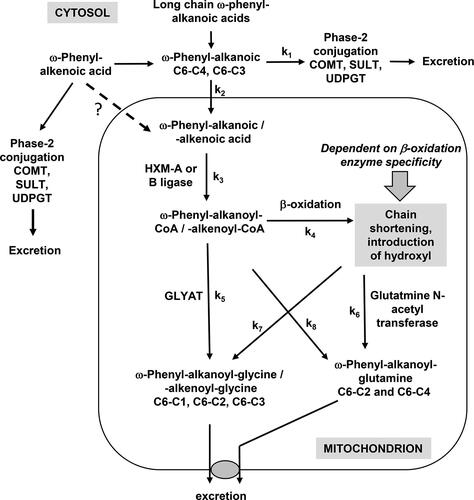
Figure 26. Structure of cinnamic acids tested in rats for modulation of lipid metabolism.
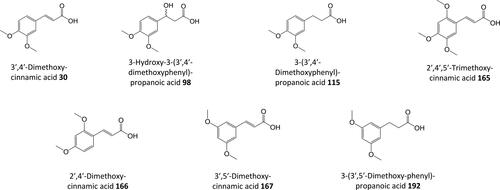
Table 1. The less common phase-2 conjugations of phenolic acids.
Table 2. Excretion, corrected for placebo, of hesperetin Phase II conjugates and 3′-hydroxy-4′-methoxyphenyl-substituted metabolites after consumption by healthy volunteers of 111 µmol (N = 15) or 348 µmol (N = 12) hesperetin in orange juice hesperetin glycosides in orange juice.
Table 3. Excretion by rats and humans of each subgroup of C6–C5 flavanol metabolites expressed as a percentage of the total C6–C5 metabolites.
Table 4. 24-Hour excretion of 3′-hydroxy-4′-methoxyphenyl-substituted C6–C3 metabolites by volunteers.
Table 5. A summary of the human metabolism of the major classes of ω-phenyl-alkanoic acids 1 and phenyl-alkenoic acids 2.