
Figures & data
Figure 1. Schematic illustration of an intelligent world, including wearable devices, intelligent bodies, and autonomous vehicles. EM absorption materials are a bridge connecting the micro and macro world. Reproduced with permission from Ref. [Citation3]. Copyright 2022. Elsevier Publication.
![Figure 1. Schematic illustration of an intelligent world, including wearable devices, intelligent bodies, and autonomous vehicles. EM absorption materials are a bridge connecting the micro and macro world. Reproduced with permission from Ref. [Citation3]. Copyright 2022. Elsevier Publication.](/cms/asset/c4319f9f-50e3-49c6-9747-6f98db14ba8f/bsms_a_2214577_f0001_c.jpg)
Figure 2. Schematic illustration of carbon nanotubes and spinel ferrite-based nanocomposites for electromagnetic interference shielding applications. Reproduced with permission from Ref. [Citation74]. Copyright 2022. Elsevier Publication. Reproduced with permission from Ref. [Citation90]. Copyright 2022. Elsevier Publication. Reproduced with permission from Ref. [Citation95]. Copyright 2022. Elsevier Publication. Reproduced with permission from Ref. [Citation113]. Copyright 2019, ACS Publication. Reproduced with permission from Ref. [Citation102]. Copyright 2022. Elsevier Publication. Reproduced with permission from Ref. [Citation110]. Copyright 2021, RSC Publication.
![Figure 2. Schematic illustration of carbon nanotubes and spinel ferrite-based nanocomposites for electromagnetic interference shielding applications. Reproduced with permission from Ref. [Citation74]. Copyright 2022. Elsevier Publication. Reproduced with permission from Ref. [Citation90]. Copyright 2022. Elsevier Publication. Reproduced with permission from Ref. [Citation95]. Copyright 2022. Elsevier Publication. Reproduced with permission from Ref. [Citation113]. Copyright 2019, ACS Publication. Reproduced with permission from Ref. [Citation102]. Copyright 2022. Elsevier Publication. Reproduced with permission from Ref. [Citation110]. Copyright 2021, RSC Publication.](/cms/asset/8a7ca9f6-cafe-43b1-b595-053a7d2f6516/bsms_a_2214577_f0002_c.jpg)
Figure 3. Dependence of EM Wave Absorption Characteristics on Impedance Matching.
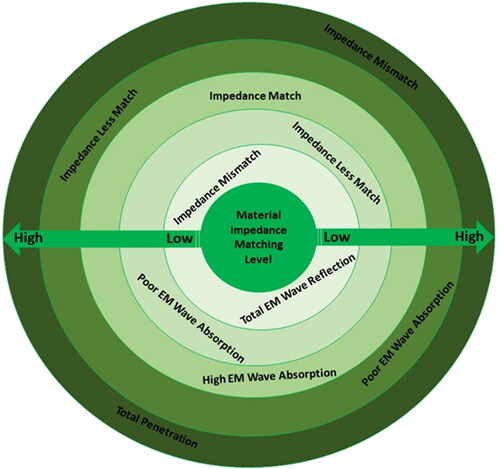
Figure 4. RL curves of Fe3O4 sample (a), Fe3O4/3 wt% CNTs (b), Fe3O4/5 wt% CNTs (c), and Fe3O4/7 wt% CNTs (d) composites. The dependence of tm on fm for Fe3O4 sample (e) and Fe3O4/CNTs composites (f–h) at wavelengths of l/4 and 3 l/4. Reproduced with permission from Ref. [Citation64]. Copyright 2017. RSC Publication.
![Figure 4. RL curves of Fe3O4 sample (a), Fe3O4/3 wt% CNTs (b), Fe3O4/5 wt% CNTs (c), and Fe3O4/7 wt% CNTs (d) composites. The dependence of tm on fm for Fe3O4 sample (e) and Fe3O4/CNTs composites (f–h) at wavelengths of l/4 and 3 l/4. Reproduced with permission from Ref. [Citation64]. Copyright 2017. RSC Publication.](/cms/asset/e143d945-2dcb-47af-a7e8-0ae83f9e149b/bsms_a_2214577_f0004_c.jpg)
Table 1. Summary of recent progress on carbon nanotube and Fe3O4 based nanocomposites.
Figure 5. (a) The frequency-dependent Z values of Fe3O4 sample and Fe3O4/CNTs composites. (b) Image of the real product for the absorber. (c, d) Scheme of primary EM microwave attenuation processes involved in Fe3O4/CNTs composites absorber. Reproduced with permission from Ref. [Citation64]. Copyright 2017. RSC Publication.
![Figure 5. (a) The frequency-dependent Z values of Fe3O4 sample and Fe3O4/CNTs composites. (b) Image of the real product for the absorber. (c, d) Scheme of primary EM microwave attenuation processes involved in Fe3O4/CNTs composites absorber. Reproduced with permission from Ref. [Citation64]. Copyright 2017. RSC Publication.](/cms/asset/9672db9a-14ef-45d2-829b-88c5f496f695/bsms_a_2214577_f0005_c.jpg)
Figure 6. The 2-D RL (a, b) and 3-D RL (e, f) curves for Fe3O4 (a, e) and Fe3O4/5CNTs (b, f). Corresponding tm dependences of fm at wavelengths of λ/4 and 3λ/4 (c, d). 2-D RL curves for Fe3O4/3CNTs (g) and Fe3O4/7CNTs (h). Reproduced with permission from Ref. [Citation66]. Copyright 2022. Elsevier Publication.
![Figure 6. The 2-D RL (a, b) and 3-D RL (e, f) curves for Fe3O4 (a, e) and Fe3O4/5CNTs (b, f). Corresponding tm dependences of fm at wavelengths of λ/4 and 3λ/4 (c, d). 2-D RL curves for Fe3O4/3CNTs (g) and Fe3O4/7CNTs (h). Reproduced with permission from Ref. [Citation66]. Copyright 2022. Elsevier Publication.](/cms/asset/f561160b-c7d8-48aa-a6fc-af421db84dad/bsms_a_2214577_f0006_c.jpg)
Figure 7. (a) Color map of the RL values calculated from the measured electromagnetic parameters, and (b) dependence of l/4 thickness on frequency for the nanocomposite. Reproduced with permission from Ref. [Citation67]. Copyright 2016. RSC Publication.
![Figure 7. (a) Color map of the RL values calculated from the measured electromagnetic parameters, and (b) dependence of l/4 thickness on frequency for the nanocomposite. Reproduced with permission from Ref. [Citation67]. Copyright 2016. RSC Publication.](/cms/asset/a7f9b7c4-eefd-4526-9a82-e56bd606a7e3/bsms_a_2214577_f0007_c.jpg)
Table 2. Summary of recent progress on carbon nanotube and CoFe2O4 based nanocomposites.
Figure 8. Schematic diagram explaining synthesis of CoFe2O4/MWCNTs composites. Reproduced with permission from Ref. [Citation74]. Copyright 2022. Elsevier Publication.
![Figure 8. Schematic diagram explaining synthesis of CoFe2O4/MWCNTs composites. Reproduced with permission from Ref. [Citation74]. Copyright 2022. Elsevier Publication.](/cms/asset/39ae50c4-e3c5-4ced-bed5-2d3c35303841/bsms_a_2214577_f0008_c.jpg)
Figure 9. (a) Frequency-dependence RL with different thicknesses, (b) simulations of the tm versus fm under the 1/4 λ model, and (c) impedance matching (Z) as a function of frequency with different thicknesses for S2 composite. Reproduced with permission from Ref. [Citation74]. Copyright 2022. Elsevier Publication.
![Figure 9. (a) Frequency-dependence RL with different thicknesses, (b) simulations of the tm versus fm under the 1/4 λ model, and (c) impedance matching (Z) as a function of frequency with different thicknesses for S2 composite. Reproduced with permission from Ref. [Citation74]. Copyright 2022. Elsevier Publication.](/cms/asset/5348cb6d-4c29-4978-8ba2-5ea3e42accbf/bsms_a_2214577_f0009_c.jpg)
Figure 10. Schematic illustration of the possible microwave absorption mechanisms of CoFe2O4/MWCNT composites. Reproduced with permission from Ref. [Citation74]. Copyright 2022. Elsevier Publication.
![Figure 10. Schematic illustration of the possible microwave absorption mechanisms of CoFe2O4/MWCNT composites. Reproduced with permission from Ref. [Citation74]. Copyright 2022. Elsevier Publication.](/cms/asset/219006b8-5425-4a5b-b8d4-3d7c01c08d65/bsms_a_2214577_f0010_c.jpg)
Table 3. Summary of recent progress on carbon nanotube and NiFe2O4 based nanocomposites.
Figure 11. The reflection loss of the Mg0.6Ni0.4Fe2O4 nanoparticles (NP: x = 0.0) and Mg0.6-xNi0.4CuxFe2O4-MWCNT nanocomposites (NC: x = 0.0, 0.2, 0.4 and 0.6). Reproduced with permission from Ref. [Citation82]. Copyright 2019. Elsevier Publication.
![Figure 11. The reflection loss of the Mg0.6Ni0.4Fe2O4 nanoparticles (NP: x = 0.0) and Mg0.6-xNi0.4CuxFe2O4-MWCNT nanocomposites (NC: x = 0.0, 0.2, 0.4 and 0.6). Reproduced with permission from Ref. [Citation82]. Copyright 2019. Elsevier Publication.](/cms/asset/6e3e4fdd-16ae-4d1a-a995-e56bed2ed96c/bsms_a_2214577_f0011_c.jpg)
Table 4. Summary of recent progress on carbon nanotube and mixed spinel ferrite based nanocomposites.
Figure 12. Reflection loss with a series of thickness, contour maps of reflection loss, and three-dimensional reflection loss for (a–c) S0, (d–f) S1, (g–i) S2, (j–l) S3. Reproduced with permission from Ref. [Citation83]. Copyright 2021. Elsevier Publication.
![Figure 12. Reflection loss with a series of thickness, contour maps of reflection loss, and three-dimensional reflection loss for (a–c) S0, (d–f) S1, (g–i) S2, (j–l) S3. Reproduced with permission from Ref. [Citation83]. Copyright 2021. Elsevier Publication.](/cms/asset/82e6f590-0d31-4085-ac83-d41dc05078be/bsms_a_2214577_f0012_c.jpg)
Figure 13. (a) Reflection loss curve, (b) matching of thickness under the λ/4 models, and (c) of different thickness for S2 with different thicknesses. Reproduced with permission from Ref. [Citation83]. Copyright 2021. Elsevier Publication.
![Figure 13. (a) Reflection loss curve, (b) matching of thickness under the λ/4 models, and (c) |Zin−1| of different thickness for S2 with different thicknesses. Reproduced with permission from Ref. [Citation83]. Copyright 2021. Elsevier Publication.](/cms/asset/f4b11bb2-7f70-485d-9b55-dcd1a37a75eb/bsms_a_2214577_f0013_c.jpg)
Figure 14. Schematic of the Synthesis Procedure of the GMFs. Reproduced with permission from Ref. [Citation88]. Copyright 2020. ACS Publication.
![Figure 14. Schematic of the Synthesis Procedure of the GMFs. Reproduced with permission from Ref. [Citation88]. Copyright 2020. ACS Publication.](/cms/asset/e87e1b49-2354-4563-8ed8-cd2950014a06/bsms_a_2214577_f0014_c.jpg)
Figure 15. (a, b) Frequency-dependent RL curves and 3D maps of GMF5. Reproduced with permission from Ref. [Citation88]. Copyright 2020. ACS Publication.
![Figure 15. (a, b) Frequency-dependent RL curves and 3D maps of GMF5. Reproduced with permission from Ref. [Citation88]. Copyright 2020. ACS Publication.](/cms/asset/a41ddfba-a0ad-4fb5-b9aa-dc0fdb67cce9/bsms_a_2214577_f0015_c.jpg)
Table 5. Summary of recent progress on graphene, carbon nanotube, and spinel ferrite based nanocomposites.
Figure 16. Illustrations for the preparation of (a) Fe3O4@MWCNTs and (b) Fe3O4@MWCNTs/RGO. Reproduced with permission from Ref. [Citation90]. Copyright 2022. Elsevier Publication.
![Figure 16. Illustrations for the preparation of (a) Fe3O4@MWCNTs and (b) Fe3O4@MWCNTs/RGO. Reproduced with permission from Ref. [Citation90]. Copyright 2022. Elsevier Publication.](/cms/asset/4c5a8cb3-f8a5-46b2-8f6c-1b2465769281/bsms_a_2214577_f0016_c.jpg)
Figure 17. EMI shielding property of different composite papers: (a) SEtotal, (b) SEA, and (c) SER values; (d) SEtotal values with different paper’s thicknesses; (e) EMI SE values of composite papers with diverse Fe3O4@MWCNTs loadings; (f) sheet resistance and electrical conductivity of composite papers; (g) schematic diagram of EMI shielding mechanism. Reproduced with permission from Ref. [Citation90]. Copyright 2022. Elsevier Publication.
![Figure 17. EMI shielding property of different composite papers: (a) SEtotal, (b) SEA, and (c) SER values; (d) SEtotal values with different paper’s thicknesses; (e) EMI SE values of composite papers with diverse Fe3O4@MWCNTs loadings; (f) sheet resistance and electrical conductivity of composite papers; (g) schematic diagram of EMI shielding mechanism. Reproduced with permission from Ref. [Citation90]. Copyright 2022. Elsevier Publication.](/cms/asset/9a0fa952-c4ab-42e7-8377-a05401568e46/bsms_a_2214577_f0017_c.jpg)
Figure 18. Reflection loss curves and the corresponding bandwidth of the maximum reflection loss that was below −10 dB of the prepared composites: sample-1 (a); sample-2 (b) and sample-3 (c). Reproduced with permission from Ref. [Citation91]. Copyright 2018. Elsevier Publication.
![Figure 18. Reflection loss curves and the corresponding bandwidth of the maximum reflection loss that was below −10 dB of the prepared composites: sample-1 (a); sample-2 (b) and sample-3 (c). Reproduced with permission from Ref. [Citation91]. Copyright 2018. Elsevier Publication.](/cms/asset/fb6eb861-0408-46a7-92c8-821e4ab87d01/bsms_a_2214577_f0018_c.jpg)
Table 6. Summary of recent progress on carbon, carbon nanotube, and spinel ferrite based nanocomposites.
Figure 19. Schematic diagram of the composite film preparation process. Reproduced with permission from Ref. [Citation94]. Copyright 2022. Elsevier Publication.
![Figure 19. Schematic diagram of the composite film preparation process. Reproduced with permission from Ref. [Citation94]. Copyright 2022. Elsevier Publication.](/cms/asset/5f04c7ee-4fca-4941-8312-21ebcf2f7d45/bsms_a_2214577_f0019_c.jpg)
Figure 20. (a-c) EMI SET, SER, and SEA of the composite films in the X-band. (d) Average EMI SE of the composite films in the X-band. Reproduced with permission from Ref. [Citation94]. Copyright 2022. Elsevier Publication.
![Figure 20. (a-c) EMI SET, SER, and SEA of the composite films in the X-band. (d) Average EMI SE of the composite films in the X-band. Reproduced with permission from Ref. [Citation94]. Copyright 2022. Elsevier Publication.](/cms/asset/7cb383dc-50da-41d8-bcfe-3a0bffc88fbc/bsms_a_2214577_f0020_c.jpg)
Figure 21. Schematic diagram of EMI shielding mechanism of the composite films. Reproduced with permission from Ref. [Citation94]. Copyright 2022. Elsevier Publication.
![Figure 21. Schematic diagram of EMI shielding mechanism of the composite films. Reproduced with permission from Ref. [Citation94]. Copyright 2022. Elsevier Publication.](/cms/asset/ae3bdf60-4513-4036-8924-31b35ee93f0c/bsms_a_2214577_f0021_c.jpg)
Table 7. Summary of recent progress on MXene, carbon nanotube and spinel ferrite based nanocomposites.
Figure 22. Schematic idea for production of ferrite nanoparticles via sol-gel method and fabrication of heterostructure composites via chemical route. Reproduced with permission from Ref. [Citation95]. Copyright 2022. Elsevier Publication.
![Figure 22. Schematic idea for production of ferrite nanoparticles via sol-gel method and fabrication of heterostructure composites via chemical route. Reproduced with permission from Ref. [Citation95]. Copyright 2022. Elsevier Publication.](/cms/asset/0d7f71e7-8f59-4c9f-ae10-1e2a738e54d1/bsms_a_2214577_f0022_c.jpg)
Figure 23. Frequency-dependent shielding effectiveness (a & b) consisting due to reflection and absorption for the composite samples along with the shielding mechanism (shown in c) in the 8.2–12.4 GHz frequency range. Reproduced with permission from Ref. [Citation95]. Copyright 2022. Elsevier Publication.
![Figure 23. Frequency-dependent shielding effectiveness (a & b) consisting due to reflection and absorption for the composite samples along with the shielding mechanism (shown in c) in the 8.2–12.4 GHz frequency range. Reproduced with permission from Ref. [Citation95]. Copyright 2022. Elsevier Publication.](/cms/asset/3ba3f012-101d-4145-954e-4a748c2386c9/bsms_a_2214577_f0023_c.jpg)
Figure 24. Schematic illustration of the synthesis process of NMWCNTs/Co0·5Zn0·5Fe2O4 hybrid composites. Reproduced with permission from Ref. [Citation100]. Copyright 2019. Elsevier Publication.
![Figure 24. Schematic illustration of the synthesis process of NMWCNTs/Co0·5Zn0·5Fe2O4 hybrid composites. Reproduced with permission from Ref. [Citation100]. Copyright 2019. Elsevier Publication.](/cms/asset/071d8467-ea33-400a-83e2-48db51b8254b/bsms_a_2214577_f0024_c.jpg)
Figure 25. Frequency dependence of reflection loss with different thicknesses and 3D plots: (a) and (a‘) S1, (b) and (b‘) S2, and (c) and (c‘) S3. Reproduced with permission from Ref. [Citation100]. Copyright 2019. Elsevier Publication.
![Figure 25. Frequency dependence of reflection loss with different thicknesses and 3D plots: (a) and (a‘) S1, (b) and (b‘) S2, and (c) and (c‘) S3. Reproduced with permission from Ref. [Citation100]. Copyright 2019. Elsevier Publication.](/cms/asset/71800419-80e9-43aa-9d54-77f7f9c1e2b1/bsms_a_2214577_f0025_c.jpg)
Figure 26. Schematic illustration of the possible microwave absorption mechanisms of NMWCNTs/Co0·5Zn0·5Fe2O4 hybrid composites. Reproduced with permission from Ref. [Citation100]. Copyright 2019. Elsevier Publication.
![Figure 26. Schematic illustration of the possible microwave absorption mechanisms of NMWCNTs/Co0·5Zn0·5Fe2O4 hybrid composites. Reproduced with permission from Ref. [Citation100]. Copyright 2019. Elsevier Publication.](/cms/asset/3957a325-74d4-42f9-a1a4-93ffd14b2655/bsms_a_2214577_f0026_c.jpg)
Table 8. Summary of recent progress on doped carbon nanotubes and spinel ferrite based nanocomposites.
Table 9. Summary of recent progress on coated carbon nanotubes and spinel ferrite based nanocomposites.
Figure 27. Illustration of the synthesis of CNT-NiFe2O4@MnO2 composites. Reproduced with permission from Ref. [Citation102]. Copyright 2022. Elsevier Publication.
![Figure 27. Illustration of the synthesis of CNT-NiFe2O4@MnO2 composites. Reproduced with permission from Ref. [Citation102]. Copyright 2022. Elsevier Publication.](/cms/asset/1392646d-b7cf-4208-a145-d0d1cf528c53/bsms_a_2214577_f0027_c.jpg)
Figure 28. (a) Quarter-wavelength matching model for three materials. Reflection loss for (b) pure CNTs, (c) CNT-NiFe2O4, and (d) CNT-NiFe2O4@MnO2 for different absorber thicknesses in the 1–5.5 mm range. The frequency dependency curves of (e) attenuation constant, (f) modulus of normalized impedance, and (g). The typical Cole-Cole semicircles for (h) pure CNT, (i) CNT-NiFe2O4, and (j) CNT-NiFe2O4@MnO2. Schematic representation of possible attenuation mechanisms in CNT-NiFe2O4@MnO2 nanomaterials: (k) Natural resonance for CNTs, MnO2 coating, and NiFe2O4 particles, (l) illustration of microwave impinged CNTs-NiFe2O4@MnO2 coating, (m) dielectric polarization, and (n) conductive loss induced by the electric and magnetic field. Reproduced with permission from Ref. [Citation102]. Copyright 2022. Elsevier Publication.
![Figure 28. (a) Quarter-wavelength matching model for three materials. Reflection loss for (b) pure CNTs, (c) CNT-NiFe2O4, and (d) CNT-NiFe2O4@MnO2 for different absorber thicknesses in the 1–5.5 mm range. The frequency dependency curves of (e) attenuation constant, (f) modulus of normalized impedance, and (g). The typical Cole-Cole semicircles for (h) pure CNT, (i) CNT-NiFe2O4, and (j) CNT-NiFe2O4@MnO2. Schematic representation of possible attenuation mechanisms in CNT-NiFe2O4@MnO2 nanomaterials: (k) Natural resonance for CNTs, MnO2 coating, and NiFe2O4 particles, (l) illustration of microwave impinged CNTs-NiFe2O4@MnO2 coating, (m) dielectric polarization, and (n) conductive loss induced by the electric and magnetic field. Reproduced with permission from Ref. [Citation102]. Copyright 2022. Elsevier Publication.](/cms/asset/83138b9f-3a3c-4931-90de-b048f0306888/bsms_a_2214577_f0028_c.jpg)
Figure 29. (a) SET, (b) dc electrical conductivity, and (c) absorption, and reflection part at 18 GHz of various blends. Reproduced with permission from Ref. [Citation107]. Copyright 2018, ACS Publication.
![Figure 29. (a) SET, (b) dc electrical conductivity, and (c) absorption, and reflection part at 18 GHz of various blends. Reproduced with permission from Ref. [Citation107]. Copyright 2018, ACS Publication.](/cms/asset/e569aa57-1e40-42a8-ac8a-b6cc773f277f/bsms_a_2214577_f0029_c.jpg)
Figure 30. (a) Schematic representation of the shielding mechanism through the synergistic contribution of both filler nanomaterials and (b) characteristic parameters for effective shielding of different blends containing different types of ferrite particles along with the MWCNTs. Reproduced with permission from Ref. [Citation107]. Copyright 2018, ACS Publication.
![Figure 30. (a) Schematic representation of the shielding mechanism through the synergistic contribution of both filler nanomaterials and (b) characteristic parameters for effective shielding of different blends containing different types of ferrite particles along with the MWCNTs. Reproduced with permission from Ref. [Citation107]. Copyright 2018, ACS Publication.](/cms/asset/273956dd-ce1b-416e-9dea-c336a3b11a75/bsms_a_2214577_f0030_c.jpg)
Table 10. Summary of recent progress on polymer, carbon nanotube, and spinel ferrite based nanocomposites.
Figure 31. Reflective loss (a) and 3D map reflective loss (b) of PDMS/CeFe2O4/MWCNTs. Reproduced with permission from Ref. [Citation108]. Copyright 2022. Elsevier Publication.
![Figure 31. Reflective loss (a) and 3D map reflective loss (b) of PDMS/CeFe2O4/MWCNTs. Reproduced with permission from Ref. [Citation108]. Copyright 2022. Elsevier Publication.](/cms/asset/3b245c1a-26e1-4a42-bb3f-49b9c4642483/bsms_a_2214577_f0031_c.jpg)
Figure 32. (a) Schematic diagram of the synthesis process of CoFe2O4/CNTs/WPU hybrid aerogels, (b) CCW-3 aerogel on top of the stamen. Reproduced with permission from Ref. [Citation110]. Copyright 2021, RSC Publication.
![Figure 32. (a) Schematic diagram of the synthesis process of CoFe2O4/CNTs/WPU hybrid aerogels, (b) CCW-3 aerogel on top of the stamen. Reproduced with permission from Ref. [Citation110]. Copyright 2021, RSC Publication.](/cms/asset/2d67fbc5-a52f-4663-8d57-b1b06fda8172/bsms_a_2214577_f0032_c.jpg)
Figure 33. Correlation between the reflection loss and frequency of the samples via 3D contour maps of CCW-1 (a), CCW-2 (b), CCW-3 (c). (d–f) Corresponding 2D contour maps of the reflection loss values of the CCW aerogels. (g) Minimum reflection loss of CCW-1, CCW-2, and CCW-3 aerogels, respectively. (h) Corresponding thickness of the samples with their optimum impedance matching values (|Zin/Z0|). (i) Curves of the attenuation constant. Reproduced with permission from Ref. [Citation110]. Copyright 2021, RSC Publication.
![Figure 33. Correlation between the reflection loss and frequency of the samples via 3D contour maps of CCW-1 (a), CCW-2 (b), CCW-3 (c). (d–f) Corresponding 2D contour maps of the reflection loss values of the CCW aerogels. (g) Minimum reflection loss of CCW-1, CCW-2, and CCW-3 aerogels, respectively. (h) Corresponding thickness of the samples with their optimum impedance matching values (|Zin/Z0|). (i) Curves of the attenuation constant. Reproduced with permission from Ref. [Citation110]. Copyright 2021, RSC Publication.](/cms/asset/bc7e19a1-7d1e-4257-abb6-ba100542471a/bsms_a_2214577_f0033_c.jpg)
Figure 34. SET of TMMM composites with 0% porosity and different MMM filler contents (a); SET of TMMM composites with different Mxene and MnFe2O4 mass ratio (b); SET, SEA, and SER of TMMM composites with 75% porosity and various thicknesses (c, d); Power coefficients (A, T, and R) as a function of frequency at 75% porosity (e); SET, SEA and SER of TMMM composites with different porosity at fixed thickness of 2.1 mm (f, g); Skin depth as a function of thickness at 75% porosity (h); Diagram of the EM waves shielding mechanism of TMMM composites (i). Reproduced with permission from Ref. [Citation111]. Copyright 2022. Elsevier Publication.
![Figure 34. SET of TMMM composites with 0% porosity and different MMM filler contents (a); SET of TMMM composites with different Mxene and MnFe2O4 mass ratio (b); SET, SEA, and SER of TMMM composites with 75% porosity and various thicknesses (c, d); Power coefficients (A, T, and R) as a function of frequency at 75% porosity (e); SET, SEA and SER of TMMM composites with different porosity at fixed thickness of 2.1 mm (f, g); Skin depth as a function of thickness at 75% porosity (h); Diagram of the EM waves shielding mechanism of TMMM composites (i). Reproduced with permission from Ref. [Citation111]. Copyright 2022. Elsevier Publication.](/cms/asset/501b6927-77b3-4036-bf30-8594349649a6/bsms_a_2214577_f0034_c.jpg)
Figure 35. (a) Total shielding effectiveness, (b) shielding effectiveness due to absorption, (c) % shielding effectiveness due to absorption and reflection, and (d) skin depth of the composites. Reproduced with permission from Ref. [Citation113]. Copyright 2019, ACS Publication.
![Figure 35. (a) Total shielding effectiveness, (b) shielding effectiveness due to absorption, (c) % shielding effectiveness due to absorption and reflection, and (d) skin depth of the composites. Reproduced with permission from Ref. [Citation113]. Copyright 2019, ACS Publication.](/cms/asset/c255fd73-6e05-49b0-a6a3-ffc012621cba/bsms_a_2214577_f0035_c.jpg)
Figure 36. Mechanism of EMI Shielding in PU-Dopa Composites. Reproduced with permission from Ref. [Citation113]. Copyright 2019, ACS Publication.
![Figure 36. Mechanism of EMI Shielding in PU-Dopa Composites. Reproduced with permission from Ref. [Citation113]. Copyright 2019, ACS Publication.](/cms/asset/4e3292f5-a9fa-4307-8971-dca1b693c28a/bsms_a_2214577_f0036_c.jpg)
Figure 37. Reflection loss of MWCNT/CuO/Fe3O4/PANI (1:3), (1:4), and (1:5) versus frequency for different absorbent thicknesses (2D, 3D). Reproduced with permission from Ref. [Citation116]. Copyright 2022, Springer Nature Publication.
![Figure 37. Reflection loss of MWCNT/CuO/Fe3O4/PANI (1:3), (1:4), and (1:5) versus frequency for different absorbent thicknesses (2D, 3D). Reproduced with permission from Ref. [Citation116]. Copyright 2022, Springer Nature Publication.](/cms/asset/b13684c9-c239-4959-9da7-ab2c256ff908/bsms_a_2214577_f0037_c.jpg)
Table 11. Summary of recent progress on semiconducting nanoparticles, carbon nanotubes, and spinel ferrite based nanocomposites.
Figure 38. The schematic diagram of fabricating CR@CNT/Fe3O4 composites. Reproduced with permission from Ref. [Citation117]. Copyright 2022. Elsevier Publication.
![Figure 38. The schematic diagram of fabricating CR@CNT/Fe3O4 composites. Reproduced with permission from Ref. [Citation117]. Copyright 2022. Elsevier Publication.](/cms/asset/2c3af89f-743e-4f3f-9a31-5b8823335a12/bsms_a_2214577_f0038_c.jpg)
Figure 39. The RL of CR@CNT/Fe3O4 composites with different thicknesses and frequencies: (a, b) CR@CNT/Fe3O4–1:0.5, (c, d) CR@CNT/Fe3O4–1:1, (e, f) CR@CNT/Fe3O4–1:1.5, (g, h) CR@CNT/Fe3O4–1:2, (i, j) CR@CNT/Fe3O4–1:3, and (k, l) CNT/Fe3O4. Reproduced with permission from Ref. [Citation117]. Copyright 2022. Elsevier Publication.
![Figure 39. The RL of CR@CNT/Fe3O4 composites with different thicknesses and frequencies: (a, b) CR@CNT/Fe3O4–1:0.5, (c, d) CR@CNT/Fe3O4–1:1, (e, f) CR@CNT/Fe3O4–1:1.5, (g, h) CR@CNT/Fe3O4–1:2, (i, j) CR@CNT/Fe3O4–1:3, and (k, l) CNT/Fe3O4. Reproduced with permission from Ref. [Citation117]. Copyright 2022. Elsevier Publication.](/cms/asset/831e47e6-9ae4-4728-9a4d-1155ec040119/bsms_a_2214577_f0039_c.jpg)
Figure 40. EMA mechanisms of CR@CNT/Fe3O4 composites. Reproduced with permission from Ref. [Citation117]. Copyright 2022. Elsevier Publication.
![Figure 40. EMA mechanisms of CR@CNT/Fe3O4 composites. Reproduced with permission from Ref. [Citation117]. Copyright 2022. Elsevier Publication.](/cms/asset/6f6fc47a-7c0a-4d5c-bfc7-ed7a53018f2d/bsms_a_2214577_f0040_c.jpg)
Table 12. Summary of recent progress on semiconducting nanoparticles, carbon nanotubes, and spinel ferrite based nanocomposites.