
Figures & data
Table 1. Plasma and urinary concentrations of nicotine and cotinine in users of nicotine delivery systems (with comparison to conventional cigarettes).
Table 2. Statements by authoritative bodies on the potential carcinogenic effect of nicotine per se.
Figure 1. Overview of findings from literature searches and criteria used for the inclusion and exclusion of publications for critical evaluation. *The total number is only 74 because several publications include both complete and modulating cancer studies.
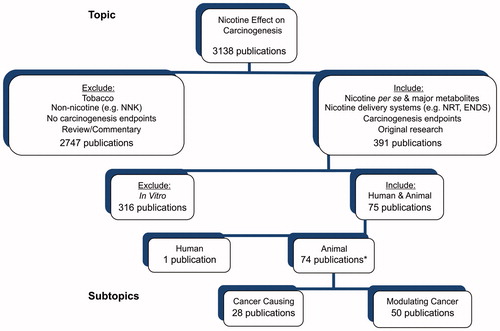
Table 3. Adequacy evaluation criteria for individual animal studies on the potential carcinogenicity of nicotine.
Figure 2. Overview of nicotine biomonitoring data in mouse and rat studies (various shaped arrows). Data referring to human exposure and blood nicotine levels are presented as a black bar indicating the range of data presented in (users of nicotine delivery systems). For species comparison, mouse data are shown from studies with oral administration via the drinking water (red color: Pietilä et al. Citation1995; Sparks & Pauly Citation1999; Grabus et al. Citation2005; Arany et al. Citation2011; AlSharari et al. Citation2013), s.c. osmotic minipump (brown color: AlSharari et al. Citation2013) and feeding (violet color: Theophilus et al. Citation2012). Rat data are shown from nicotine inhalation (black color: Werley et al. Citation2014), continuous s.c. administration via minipump (dark blue color: Cheng et al. Citation2005), and feeding (blue color: Theophilus et al. Citation2012).
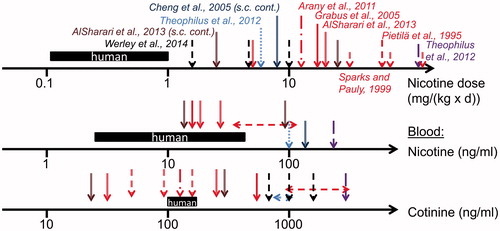
Table 4. Reported findings of relevant studies for evaluating the potential of nicotine to act as a complete carcinogen.
Figure 3. Overview of nicotine biomonitoring data in mouse and rat studies investigating potential nicotine-mediated carcinogenesis. Data (indicated by arrows) were generated in a rat inhalation study (Waldum et al. Citation1996) and in mouse studies with exposure to nicotine via drinking water (Wong et al. Citation2007; Maier et al. Citation2011; Murphy et al. Citation2011; Hermann et al. Citation2014; Li et al. Citation2015), via continuous s.c. administration (Hao et al. Citation2013), via i.v. administration (Li et al. Citation2015) and via patch and i.p. administration (Davis et al. Citation2009). Nicotine doses and nicotine and cotinine levels in blood and urine from users of nicotine delivery systems such as NRT products or ENDS are illustrated as black bars (blood) or diamonds and bars (urine) indicating the range of concentrations (from data presented in ). Positive (cancer stimulating) and negative studies are characterized by red and green colors, respectively.
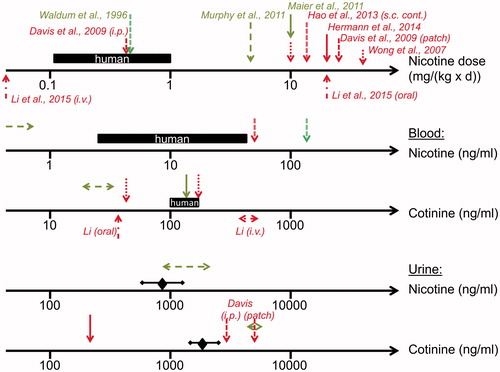
Table 5. Reported findings of relevant studies for evaluating the potential cancer modulating activity of nicotine in studies induced by physical, chemical, or transgenic means.
Table 6. Reported findings of relevant studies for evaluating the potential cancer modulating activity of nicotine in xenograft studies.
Figure 4. Cancer modulating activity as judged positive or negative by respective authors for mouse studies using nicotine administration via drinking water (stratified by average estimated daily nicotine dose). Positive modulating activity refers to stimulating carcinogenesis. Negative activity is the lack of a stimulating effect. Symbols characterize chemical/physical/transgene-based (circles) and cancer cell-based (triangles) studies with high (full symbols) and low (open symbols) adequacy scores.
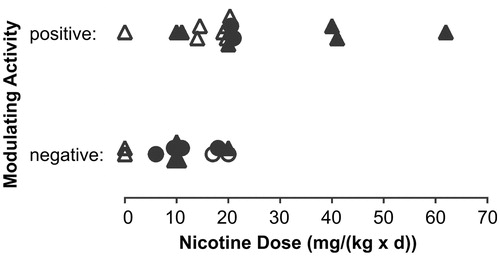
Table 7. Reported findings of relevant studies for evaluating the potential of nicotine metabolites to act as complete carcinogens.
Table 8. Reported findings of relevant studies for evaluating the potential cancer modulating activity of nicotine metabolites.
Table 9. Strength of evidence classification for nicotine to act as a carcinogen or carcinogenesis modulator in human and animal studies.