
Figures & data
Table 1. Literature search strategy keywords.
Table 2. Inclusion and exclusion criteria.
Table 3. Criteria from Klimisch et al. (Citation1997).
Table 4. Literature identified from authoritative reviews and literature searching.
Table 5. Results of the study quality analysis.
Table 6. Summary or studies considered for evaluation in the QRA
Table 7. Reproductive performance of fertile pairs during continuous breeding (task 2) methyl salicylate (Gulati et al. Citation1984).
Table 8. Litter data for individual mating pairs (Gulati et al. Citation1984).
Figure 1. (a) Graph of benchmark modeling output for number of litters per mating pair reported in Gulati et al. (Citation1984). Linear model with BMR of 1 standard deviation for the BMD and 0.95 lower confidence limit for the BMDL. (b) Graph of benchmark modeling output for number of litters per mating pair reported in Gulati et al. (Citation1984). Power Model with BMR of 1 standard deviation for the BMD and 0.95 lower.
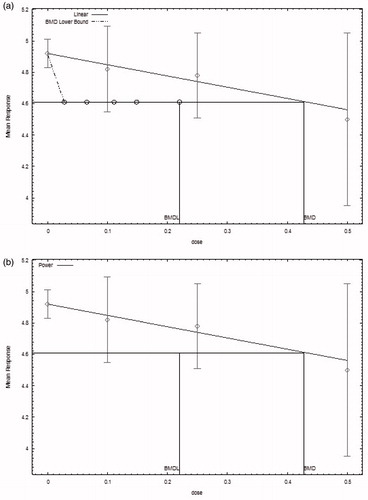
Table 9. BMD results from Gulati et al. (Citation1984).
Table 10. Individual breeding pair BMD modeling results for Gulati et al. (Citation1984).