Figures & data
Table 1. Comparison of explicit (EUFs) and implicit safety margins (ISMs) applied by SCOEL in the periods 1991–2003Table Footnote a and 2004–2017.
Figure 1. Explicit uncertainty factors (EUF) and implicit safety margins (ISM) plotted over the year of the SCOEL document. Linear regression on log transformed EUFs and ISMs: EUFs β = −0.009, p = .14, r 2 = 0.03; ISMs β = −0.006, p = .21; r 2 = 0.03; combined β = −0.01, p = .006, r 2 = 0.06.
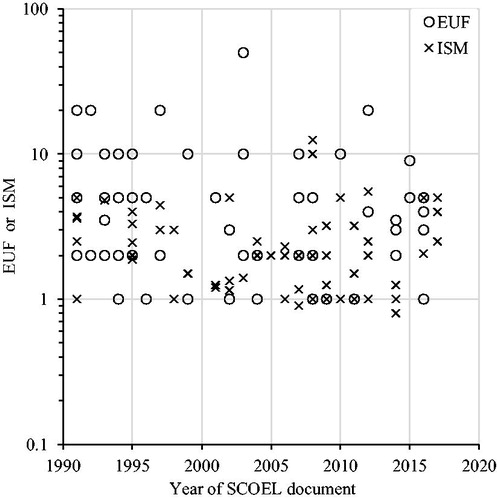
Figure 2. Explicit uncertainty factors (EUFs) and implicit safety margins (ISMs) plotted over the year of the most recent key study. Linear regression on log transformed EUFs and ISMs: EUFs β = −0.01, p = .004, r 2 = 0.12; ISMs β = −0.002, p = .34, r 2 = 0.01; combined β = −0.007, p = .002, r 2 = 0.08.
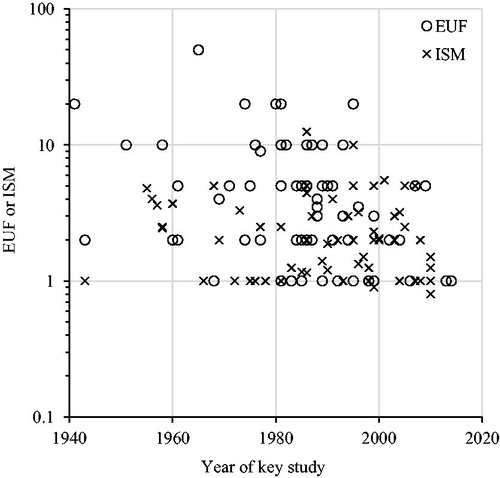
Figure 3. Number of references per document plotted over year of document. Linear regression on log transformed reference counts: β = 0.11, p < .0001, r 2 = 0.69.
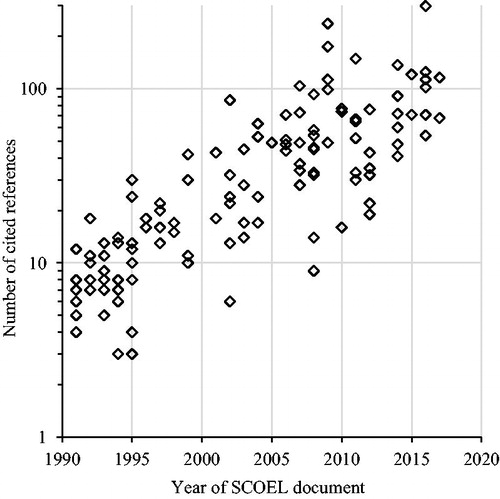
Figure 4. Explicit uncertainty factors (EUFs) and implicit safety margins (ISMs) plotted over nature of critical effect. Resp. tract: respiratory tract damage; Hemato.: hematological effects; Neuro.: neurotoxicity. Horizontal bars indicate median values. Numbers (n) indicate number of substances (EUFs/ISMs), only categories with at least five EUFs and ISMs were included. ANOVA analysis (log transformed values): EUFs p = .08, ISMs p = .07; combined p = .009. Pairwise comparisons showed that EUFs and ISMs combined were significantly lower for hematological effects than for liver/kidney toxicity (p = .05, t-tests with pooled standard deviations and Bonferroni correction of p values).
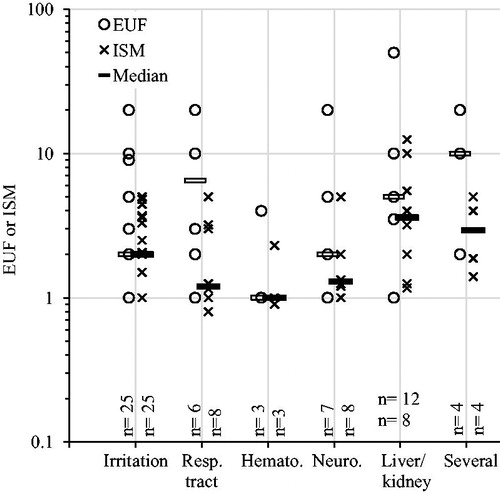
Figure 5. Explicit uncertainty factors (EUFs) and implicit safety margins (ISMs) plotted over type of data used as point of departure (PoD). Numbers (n) indicate number of substances. Both EUFs and ISMs were lower for human PoDs than for animal PoDs (EUF p = .008, ISM p = .004, Welch’s t-test on log transformed values). ISMs and ISMs and EUFs combined were lower than for PoDs that were NOAECs than for PoDs that were LOAECs (EUF p = .3 ISM p = .009 combined p = .04, Welch’s t-test on log transformed values).
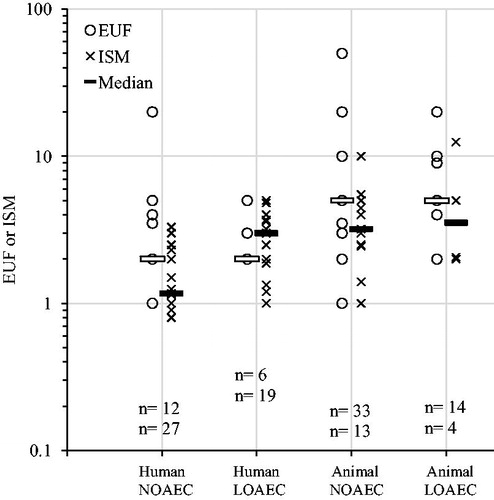
Figure 6. Explicit uncertainty factors (EUFs) and implicit safety margins (ISMs) plotted over exposure duration of the key study. Horizontal bars indicate median values. Numbers (n) indicate number of substances (EUFs/ISMs). ANOVA analysis (log transformed values): EUFs p = .5; ISMs p = .03; combined p = .02. Pairwise comparisons showed that ISMs for subchronic PoDs were significantly higher than ISMs for acute and chronic PoDs (p = .03 and p = .05, t-tests with pooled standard deviations and Bonferroni correction of p values). Pairwise comparisons for the ISMs and EUFs combined showed that subchronic values were significantly higher than acute (p = .02, t-tests with pooled standard deviations and Bonferroni correction of p values).
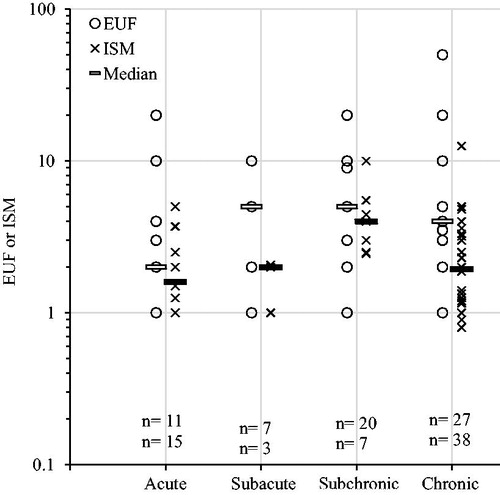
Figure 7. Explicit uncertainty factors (EUFs) and implicit safety margins (ISMs) plotted over publication type of key study, see methods for definitions. Numbers (n) indicate number of substances (EUFs/ISMs). Horizontal bars indicate median values. ANOVA analysis (log transformed values): EUFs p = .2; ISMs p = .9; combined p = .7.
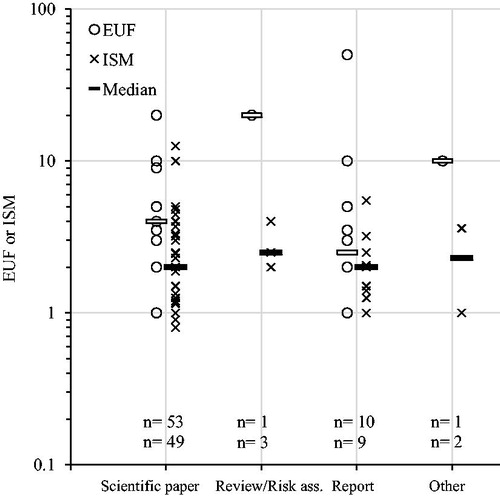
Figure 8. Explicit uncertainty factors (EUFs) and implicit safety margins (ISMs) plotted over level of vested interest category, see methods for definitions. Horizontal bars indicate median values. Numbers (n) indicate number of substances (EUFs/ISMs). ANOVA analysis (log transformed values): EUF p = .6; ISM p = .8; combined p = .4.
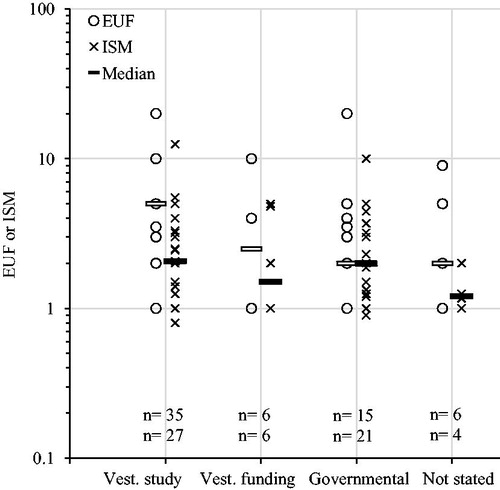
Figure 9. Explicit uncertainty factors (EUFs) and implicit safety margins (ISMs) plotted over number of active registrations (as of October 2017). Log scale on both y- and x-axis, unregistered substances are plotted at 0.2 (left in figure). Linear regression on log transformed EUFs and ISMs: EUF β = −0.003, p = .02, r 2 = 0.08; ISMs β = −0.0008, p = .16, r 2 = 0.03; combined β = −0.002, p = .005, r 2 = 0.06.
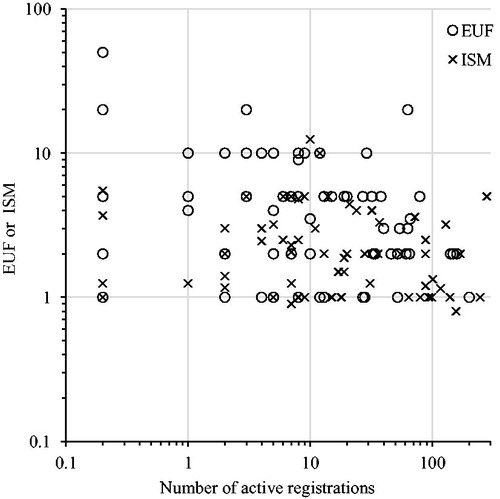
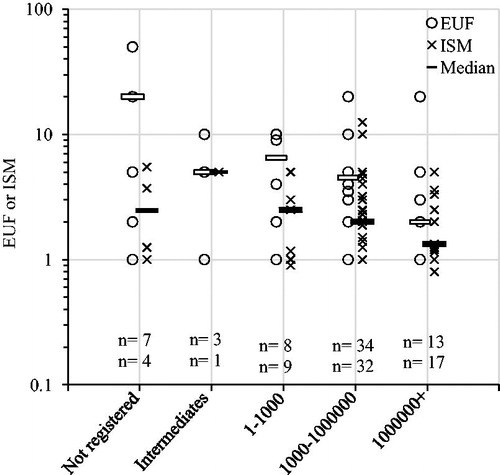
Figure 10. Explicit uncertainty factors (EUFs) and implicit safety margins (ISMs) plotted over total registered tonnage groups (as of October 2017). Horizontal bars indicate median values. Numbers (n) indicate number of substances (EUFs/ISMs). ANOVA analysis (log transformed values): EUFs p = .1; ISMs p = .3; combined p = .02. Pairwise comparisons showed that EUFs and ISMs combined were higher for not registered substances than for substances in the highest tonnage category (p = .01, t-tests with pooled standard deviations and Bonferroni correction of p values).