5,512
Views
34
CrossRef citations to date
0
Altmetric
Review Articles

Hexavalent chromium and stomach cancer: a systematic review and meta-analysis

, , , , , , & show all
Pages 140-159 | Received 25 Oct 2018, Accepted 31 Jan 2019, Published online: 21 Mar 2019

Figures & data

Table 1. Inclusion criteria.

Table 2. Meta-analysis descriptions.

Figure 1. Literature Search Results (in accordance to PRISMA reporting). *Hand searching was based on the reference citations of previously published meta-analyses and recent government documents, i.e., ATSDR Citation2012; Cole and Rodu Citation2005; Gatto et al. Citation2010; NIOSH Citation2013; Welling et al. Citation2015.

Figure 1. Literature Search Results (in accordance to PRISMA reporting). *Hand searching was based on the reference citations of previously published meta-analyses and recent government documents, i.e., ATSDR Citation2012; Cole and Rodu Citation2005; Gatto et al. Citation2010; NIOSH Citation2013; Welling et al. Citation2015.

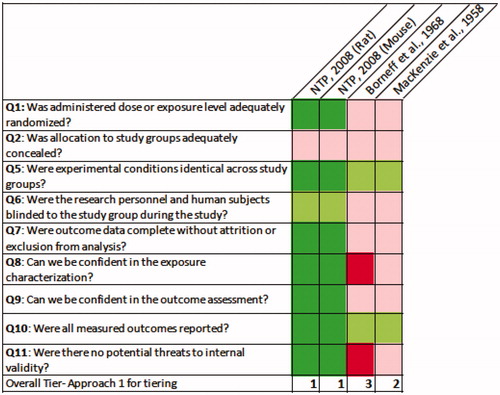
Table 3. Data extraction of experimental animal studies (n = 4).

Figure 2. Risk of bias assessment and tier classifications for experimental animal studies (n = 4). Colors: red, (−−; definitely high risk of bias), pink (−; probably high risk of bias), light green (+; probably low risk of bias), dark green (++; definitely low risk of bias). Tiers: 1 (Tier 1), 2 (Tier 2), 3 (Tier 3).

Figure 2. Risk of bias assessment and tier classifications for experimental animal studies (n = 4). Colors: red, (−−; definitely high risk of bias), pink (−; probably high risk of bias), light green (+; probably low risk of bias), dark green (++; definitely low risk of bias). Tiers: 1 (Tier 1), 2 (Tier 2), 3 (Tier 3).

Table 4. Summary of evidence synthesis and confidence in experimental animal studies.

Figure 3. Funnel plot of all occupational studies (n = 44) included for meta-analysis.

Figure 3. Funnel plot of all occupational studies (n = 44) included for meta-analysis.

Figure 4. Meta-analysis 1: All human occupational studies (n = 44). For the individual studies, 95%CIs are calculated intervals based on the effect size and parameters of the random-effects model.

Figure 4. Meta-analysis 1: All human occupational studies (n = 44). For the individual studies, 95%CIs are calculated intervals based on the effect size and parameters of the random-effects model.

Figure 5. Meta-analysis 2: Tier 3 removed from human occupational studies (remaining studies, n = 13). For the individual studies, 95%CIs are calculated intervals based on the effect size and parameters of the random-effects model. Tier 3: Studies with definitely high or probably high risk of bias for at least two of the key NTP OHAT questions (Q4, Q8, and Q9 related to exposure, confounding, and outcome, respectively).

Figure 5. Meta-analysis 2: Tier 3 removed from human occupational studies (remaining studies, n = 13). For the individual studies, 95%CIs are calculated intervals based on the effect size and parameters of the random-effects model. Tier 3: Studies with definitely high or probably high risk of bias for at least two of the key NTP OHAT questions (Q4, Q8, and Q9 related to exposure, confounding, and outcome, respectively).

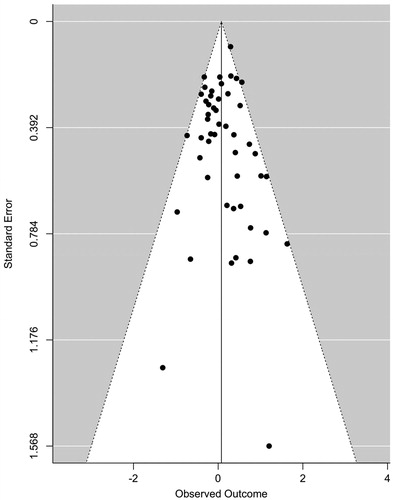
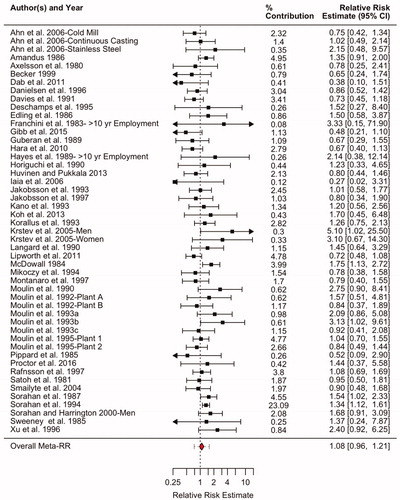
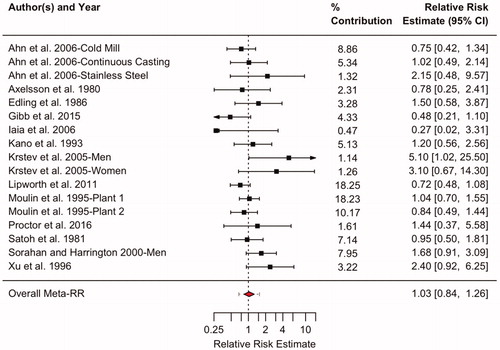
Table 5. Meta-analysis results (Human occupational data).

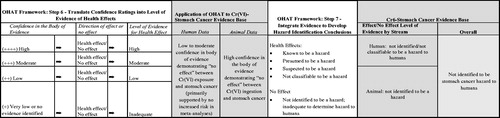
Table 6. Summary of evidence synthesis and confidence in human occupational studies.

Figure 6. Application of the NTP OHAT (Citation2015) framework of systematic review and evidence integration for developing hazard identification conclusions.

Figure 6. Application of the NTP OHAT (Citation2015) framework of systematic review and evidence integration for developing hazard identification conclusions.
Supplemental material

Supplemental_Figs_Jan_2019.docx

Download MS Word (40.1 MB)

Supplemental_Table_H_Comp_All_studies.pdf

Download PDF (241.5 KB)

Supplemental_Table_G_Meta-Analysis_Comp.docx

Download MS Word (15.1 KB)

Supplemental_Table_F_Trim_and_Fill.docx

Download MS Word (14.2 KB)

Supplemental_Table_E_All_Included_Studies.pdf

Download PDF (537.1 KB)

Supplemental_Table_D_Excluded_Citations.pdf

Download PDF (358 KB)

Supplemental_Table_C_NTP_ROB_Qs.docx

Download MS Word (14.2 KB)

Supplemental_Table_B_Non_Occup_Data.docx

Download MS Word (15.3 KB)

Supplemental_Table_A_PMR_PCMR.pdf

Download PDF (193 KB)