Figures & data
Table 1. Potential use of NAMs to support the hazard and risk assessment of chemical mixtures.
Figure 1. Mapping of different types of toxicity information for individual chemicals in a mixture onto AOP networks. This mapping can help identify (1) which chemicals might lead to combined effects/common adverse outcomes, (2) where information is missing, and (3) further targeted testing needs. MIE: molecular initiating event; KE: key event; AO: adverse outcome.
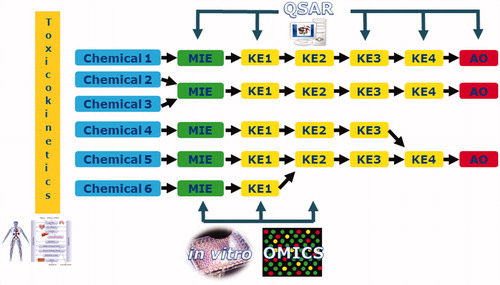
Table 2. Uncertainties related to mixture risk assessment.
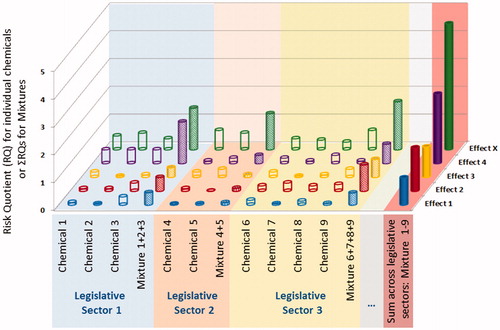
Figure 2. Mapping of chemicals and their mixtures to the risks they pose for various toxicological effects. For each chemical (1–9) the individual Risk Quotients are presented for different types of effect (effect 1-X, e.g. hepatotoxicity, neurotoxicity, etc.). Chemicals are grouped according to the legislative sector they are regulated under (e.g. REACH, pesticides, cosmetics, food contaminants, etc.). The Sum of Risk Quotients is illustrated for mixtures within each sector and in the last column for the cross-sectorial mixture.