Figures & data
Figure 1. Distribution of the 411 substances over the different categories. Clockwise: Genotoxic carcinogen: positive in in vitro and in vivo genotoxicity/mutagenicity assays; Nongenotoxic carcinogen: substances with the reported treatment-related increase in incidence of benign or malignant tumors without in vivo evidence of genotoxicity; noncarcinogen: substance without reported treatment-related increase in incidence of benign or malignant tumors; Excluded: substance without sufficiently detailed or reliable tumor data available.
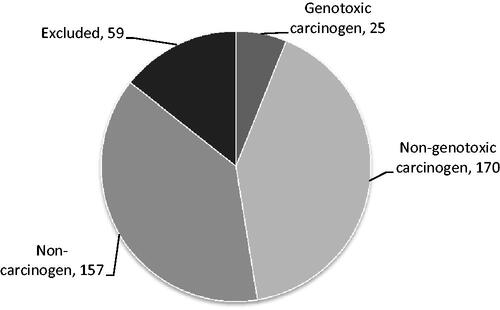
Figure 2. Number of treatment-related tumor types per each of the 170 nongenotoxic substances.
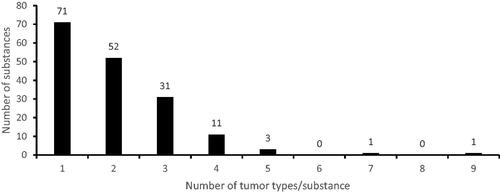
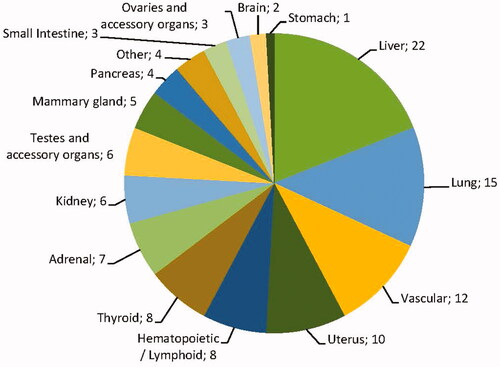
Figure 3. Organ distribution of all 340 observed treatment-related tumors with a suspected nongenotoxic MOA. The category “Other” includes bone, skin, eye, and prostate tumors.
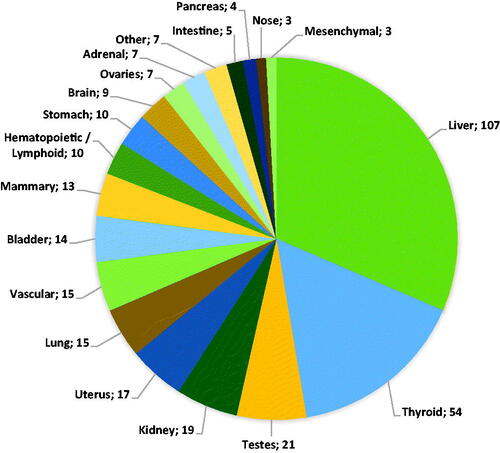
Table 1. Summary table describing all discerned MOAs and MOA networks.
Figure 4. The number of MOAs activated per each nongenotoxic carcinogen.
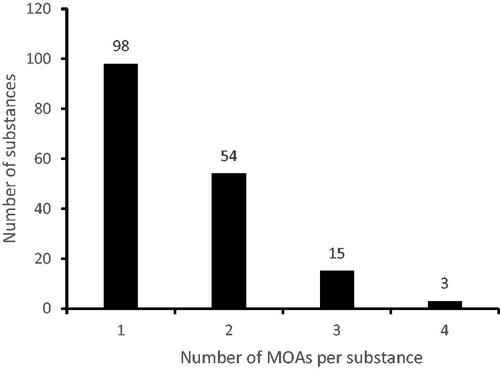
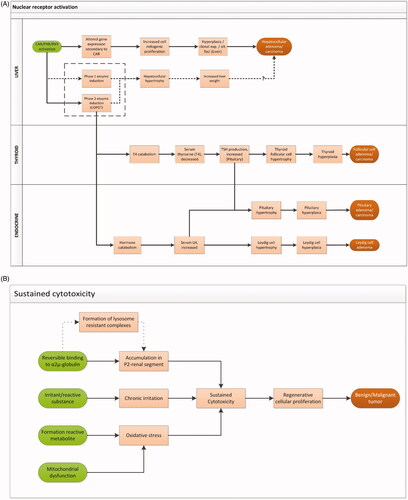
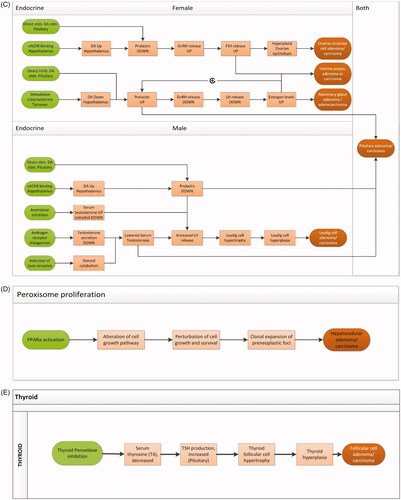
Figure 6. Overview of the number of tumors with an unidentified MOA. In total, there are 116 tumors in various organs induced by 74 unique substances.