Figures & data
Table 1. Key epidemiological studies for human immune response to PFAS exposures (as PFAS in serum).
Table 2. Key animal toxicity studies to evaluate immune response to PFOA and/or PFOS since 2016.
Table 3. Expert panel participants.
Table 4. Key areas of improvement with current animal models for immunotoxicity.
Table 5. Key covariates to consider for establishing fluctuations in vaccine antibody titer (VAT).
Table 6. Recommended biomarkers and metrics for establishing potential immunotoxicity in human studies and animal bioassays.
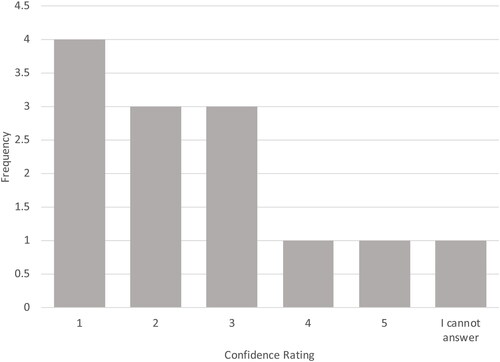
Figure 1. Panelist responses to how the Budtz-Jørgensen and Grandjean (Citation2018) study should be used in a risk assessment for PFAS/PFOA.
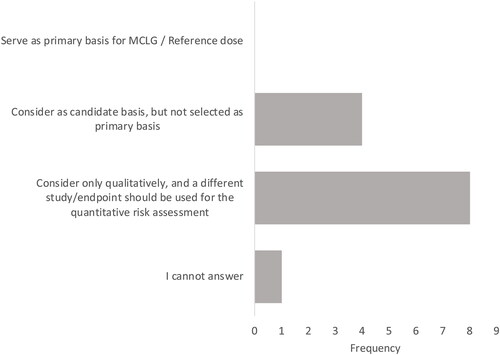
Figure 2. Mean confidence ratings by subpanel for each of the modified Bradford Hill criteria for causality.
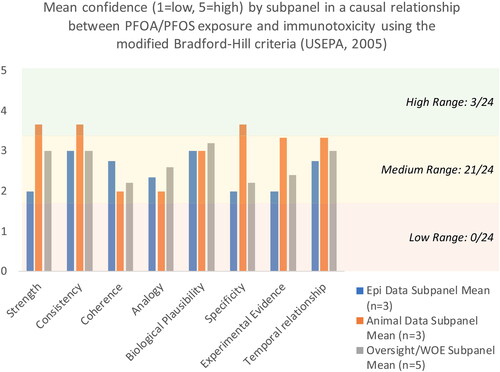
Figure 3. Ratings for how well evidence for PFOA and PFOS support extrapolation to other PFAAs. 1 = extrapolation is not supported; 5 = extrapolation strongly supported.