
Figures & data
Table 1. Monoamine based, aminocarboxylic acid chelating agents.
Table 2. Thermodynamic stability constants (log K values).
Table 3. Conditional complex building constants for EDG, NTA, MGDA, GLDA and EDTA.
Figure 1. Metal-complexes of NTA (left panel) and MGDA (right panel). Due to steric hindrance the additional methyl group in MGDA is expected to stick out enlarging the overall three-dimensional size of the metal complex.
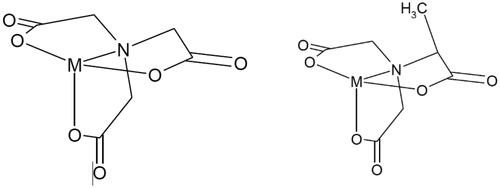
Table 4. Solubility of Ca-bound chelating agents.
Table 5. Repeat dose toxicity data and data on genotoxicity of EDG, NTA, MGDA and GLDA.
Table 6. Levels of (metal)ions in urine compared to controls (biomarker study; HIHS Citation2013).
Figure 2. Overview of urinary tract findings induced by EDG, NTA, MGDA, GLDA and EDTA. *Read-across to NTA as Ca-microcrystal formation is likely due to the very low solubility of EDG-Ca and because marked renal toxicity was noted in vivo.
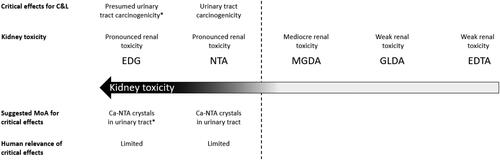
Table 7. Levels of sodium, calcium and zinc in blood and urine of untreated rats.
Table 8. Levels of kidney biomarkers in urine compared to controls (biomarker study; HIHS Citation2013).
Table 9. Mean labeling indices (LI) for kidney cortical proximal tubular cells (biomarker study; HIHS Citation2013).