Figures & data
Table 1 Major categories of synthetic pesticides
Table 2 The elements of hazard characterization of dietary chemicals
Figure 1. Frequency of detecting at least one type of pesticide residue in organic and conventional fruits and vegetables. Data on pesticide residues in organically grown foods (gray bars) and foods with no market claim (assumed to be conventionally grown; black bars) were collected from the Pesticide Data Program of the US Department of Agriculture. The total number of samples tested is shown on top of the respective bars. Derived from CitationBaker et al. (2002).
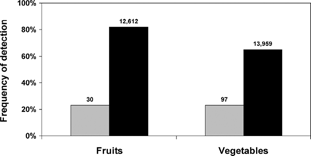
Figure 2. Ten-year trends of contamination rates with pesticides of organic and conventional fruits and vegetables. Data on pesticide residues in organically grown foods (gray squares) and foods with no market claim (assumed to be conventionally grown; black squares) were collected from the Marketplace Surveillance Program of the California Department of Pesticide Regulation. A total of 67,154 samples (1,097 organic and 66,057 conventional) were examined. Derived from CitationBaker et al. (2002).
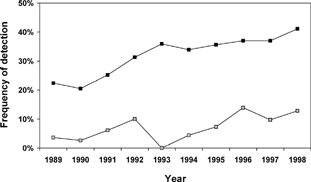
Figure 3. Organochlorine and non-organochlorine pesticide residues in organic and conventional vegetables. Data on organochlorine pesticide (OCP) and non-OCP residues in organically grown vegetables (97 samples, gray bars) and those with no market claim (assumed to be conventionally grown; 13,959 samples, black bars) were collected from the Pesticide Data Program of the US Department of Agriculture. Residue detection frequencies are shown on top of the respective bars, and have been determined for all the pesticides combined, for pesticides other than the OCPs, and for the OCPs only. The latter category, therefore, represents food samples containing only OCP residues. Derived from CitationBaker et al. (2002).
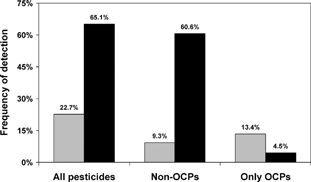
Figure 4. Pesticide residues in organic and conventional olive oil. Residues of fenthion (squares) and dimethoate (triangles) pesticides were determined in organic and conventional olive oils from Crete during 1997–1999. The ratio of the mean concentration of conventional to that of organic produce is shown. Derived from CitationTsatsakis et al. (2003).
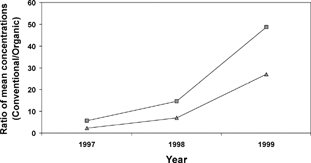
Figure 5. Factors affecting cadmium input to soil and uptake by plants. Derived from CitationLinden et al. (2001) and CitationMoolenaar and Lexmond (1999).
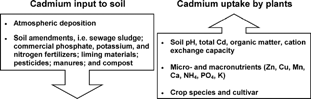
Figure 6. Nitrate content of organic and conventional crops. The results from 18 published studies including a total of 176 comparisons on the nitrate content of organic and conventional crops, including beetroot, cabbage, carrot, celeriac, chard, corn salad, endive, kale, leek, lettuce, potato, radish, spinach, and turnip, are presented. The percent of total comparisons indicating lower (gray bars), equal (white bars), or higher (black bars) nitrate content in organic compared with conventional produce is shown. Derived from CitationWorthington (2001).
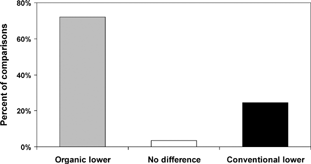
Table 3 Pesticides approved for use in organic farming
Table 4 The health risks of some organic pesticides
Figure 7. Use of potentially hazardous practices among organic producers. During December 1997 and January 1998, a fifteen-page questionnaire was mailed to 4,638 certified organic producers throughout the US, asking for information about a variety of topics corresponding to their farms. For the practices shown in the figure, respondents (approximately 1,060 for each category) were asked to indicate their frequency of use pertaining to each of the management strategies or materials shown. Derived from CitationWalz (1999).
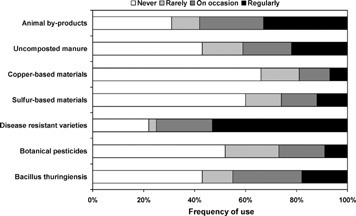
Figure 8. Microbiological status of organic and conventional chard. The native microflora of fresh Swiss chard (Beta vulgaris, type cicla) cultivated by organic (CitationPonce et al., 2003) (gray bars) and conventional (CitationPonce et al., 2002) (black bars) methods was quantified and characterized from 28 different samples of each type. Values are shown as mean ± standard deviation. No significant differences in the microbial populations between the two types of produce were identified. Derived from CitationPonce et al. (2002, Citation2003).
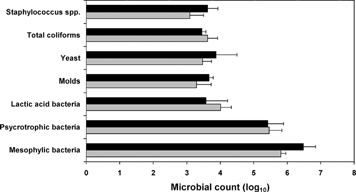
Table 5 Mycotoxin contamination in organic and conventional cereal crops
Figure 9. Patulin contamination in organic and conventional fresh apples and apple juice. Twelve samples of fresh apples (2 kg/sample) (CitationMalmauret et al., 2002) and twenty-one commercially available apple juices (CitationBeretta et al., 2000) from organic and conventional production were analyzed for the presence of patulin. Values are shown as mean ± standard deviation. *P < 0.05 vs. conventional produce. Derived from CitationMalmauret et al. (2002) and CitationBeretta et al. (2000).
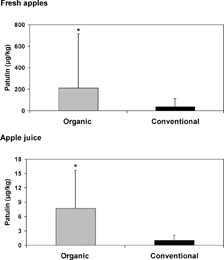
Figure 10. Deoxynivalenol contamination in organic and conventional wheat. Eleven conventional and eleven organic samples of wheat (1 kg/sample) were tested for the presence of deoxynivalenol. Median (black squares), mean (black circles), and maximum (black triangles) levels of contamination are shown, along with the frequency of detection of positive samples (gray bars). Derived from CitationMalmauret et al. (2002). Mean levels are reported in CitationLeblanc et al. (2002).
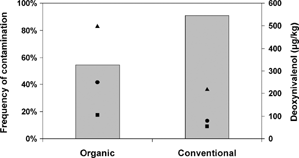
Table 6 Comparison of organic and conventional products with respect to food hazards
Figure 11. A simple and interpretative model for consumers' attitude toward food-associated risks. Redrawn with permission after CitationMorasso et al. (2000).
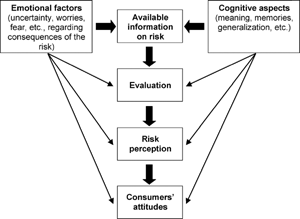
Table 7 Causative agents of foodborne diseases
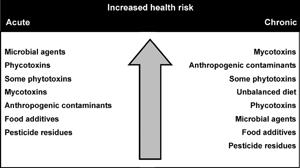
Figure 12. Relative importance of food hazards for human health. The figure ranks several food hazards according to their potency to cause an acute or chronic effect, regardless of cultivation origin (i.e. organic or conventional). Adapted with permission from CitationMagkos et al. (2003b).