Figures & data
Figure 1. Protein S-acylation. (A) Scheme of the protein S-acylation reaction. The acyl moiety from an acyl-CoA is covalently bound to the thiol group of a cysteine residue through a thioester bond. The direct reaction is catalyzed by DHHC S-acyltransferases and the reverse reaction is catalyzed by acyl protein thioesterases. The attached acyl chain is typically C16:0 but other chain length and saturation are possible (variable “n”). (B) Schematic representation of DHHC S-acyltransferases, highlighting their membrane topology and conserved motifs (see text for details). While most of the members of the family have four transmembrane domains (TMDs) as shown here, up to six TMDs are found in some of them. (C) Membrane topology for human zDHHC22 as predicted using TMHMM v2.0 DTU Bioinformatics, Denmark. Similar results are obtained using the predictor TMpred (ExPASy, SIB, Switzerland) (not shown) (see color version of this figure at www.tandfonline.com/ibmg).
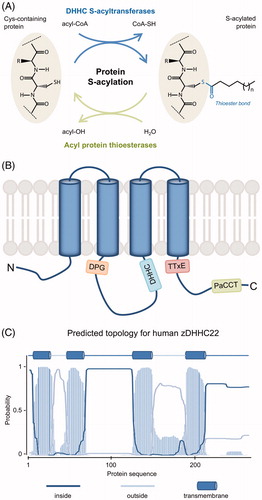
Table 1. Methods to study protein S-acylation. See text for more details.
Table 2. Structural specificities of human DHHC S-acyltransferases (DHHC PATs).
Table 3. Protein abundance (in copy number per cell) for enzymes involved in protein S-(de)acylation, as reported in quantitative proteomics studies.
Figure 2. X-ray crystal structures of DHHC S-acyltransferases. (A) Cartoon representation of the X-ray crystal structures of human zDHHC20 (cyan, PDB 6BMN) and zebrafish zDHHC15 (blue, PDB 6BMS) highlighting their strong overlap. (B) Cartoon representation of human zDHHC20 covalently bound to 2-bromopalmitate (PDB 6BML). The 2-bromopalmitate molecule is shown as red and yellow spheres and the surface of the protein is depicted to highlight the insertion of the lipid into the hydrophobic cavity formed by the four transmembrane domains of the protein. (C) Cartoon and sticks representation of the active site and acyl chain cavity of human zDHHC20 covalently bound to 2-bromopalmitate (PDB 6BML). The four residues forming the DHHC motif are shown in cyan, the acyl chain of 2-bromopalmitate is shown in yellow and the hydrophobic residues contributing to the acyl chain binding cavity (as described in Rana et al. Citation2018) are shown in green. Highlighted in pink is residue Thr241 (from the TTxE motif) forming a hydrogen-bonding network with the catalytic residues (dashed lines). Zn ions are shown as spheres in all representations. The disposition of the protein relative to the membrane is approximately indicated by light brown lines. Figure created using Pymol v0.99 (DeLano Scientific, San Carlos, CA) (see color version of this figure at www.tandfonline.com/ibmg).
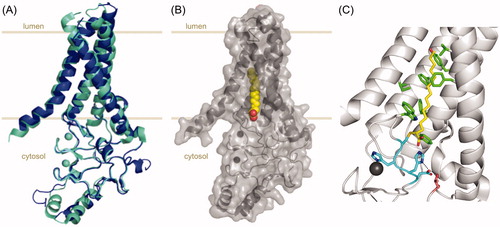
Figure 3. Tridimensional structure of acyl protein thioesterases. (A) Cartoon representation of the X-ray crystal structure of human APT1 (PDB 1FJ2) showing its seven-stranded α/β hydrolase fold and highlighting the position of the catalytic triad (Ser119, Asp174, and His209, shown as sticks). (B) Cartoon and sticks representation of the active site of human APT2 co-crystallized with its selective inhibitor ML349 (PDB 5SYN). The inhibitor is shown in green and the catalytic triad Ser122-Asp176-His220 is highlighted in cyan. Figure created using Pymol v0.99 (DeLano Scientific, San Carlos, CA) (see color version of this figure at www.tandfonline.com/ibmg).
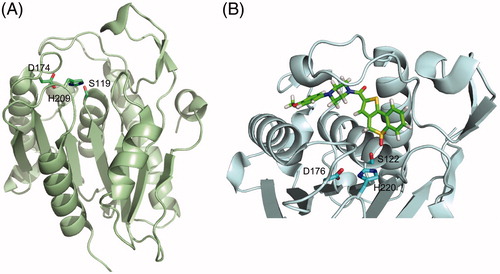
Figure 4. Chemical structures of the S-(de)acylation inhibitors and probes mentioned in this review (see color version of this figure at www.tandfonline.com/ibmg).
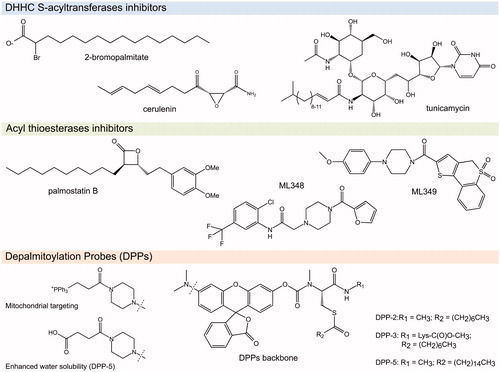
Figure 5. Mathematical modeling of S-acylation data. For a protein with two S-acylation sites, an open system with five possible species (U: unfolded; C00: folded, non-acylated; C10 and C01: S-acylated in one or the other site; C11: doubly-acylated) is modeled and the transitions between species can be represented using a set of ordinary differential equations. The model is fed with quantitative experimental data, such as [35S]-cysteine/methionine pulse-chase or [3H]-palmitate incorporation, and iterative cycles of calibration, prediction, and validation are followed until an adequate model is obtained. A model capturing the system allows to deconvolute experimental data into the contribution of each species and thus to study the effect of each S-acylation event on protein stability and function. OE: overexpression, KD: knock-down. See text for more details (see color version of this figure at www.tandfonline.com/ibmg).
![Figure 5. Mathematical modeling of S-acylation data. For a protein with two S-acylation sites, an open system with five possible species (U: unfolded; C00: folded, non-acylated; C10 and C01: S-acylated in one or the other site; C11: doubly-acylated) is modeled and the transitions between species can be represented using a set of ordinary differential equations. The model is fed with quantitative experimental data, such as [35S]-cysteine/methionine pulse-chase or [3H]-palmitate incorporation, and iterative cycles of calibration, prediction, and validation are followed until an adequate model is obtained. A model capturing the system allows to deconvolute experimental data into the contribution of each species and thus to study the effect of each S-acylation event on protein stability and function. OE: overexpression, KD: knock-down. See text for more details (see color version of this figure at www.tandfonline.com/ibmg).](/cms/asset/73a7a048-5ec6-4649-a8e6-7e7fa24c45ff/ibmg_a_1488804_f0005_c.jpg)
Figure 6. Schematic representation of zDHHC6 S-acylation cascade. zDHHC6 requires S-acylation for activation and subsequent S-acylation of its different substrates, including transferrin receptor (TfnR), calnexin (CNX), and inositol 1,4,5-triphosphate (IP3) receptor type 1 (IP3R1). zDHHC6 S-acylation is mediated by zDHHC16 and S-deacylation is catalyzed by APT2. The latter is susceptible to S-acylation and deacylation by a yet-to-be-identified zDHHC PAT and APT1, respectively, which, in turn, can potentially require S-acylation for function (see color version of this figure at www.tandfonline.com/ibmg).
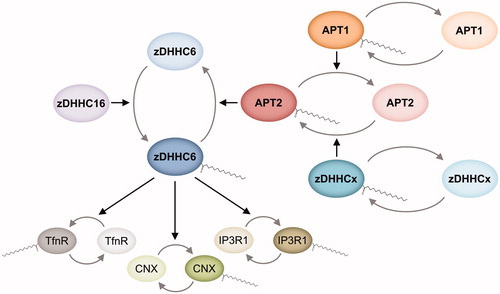
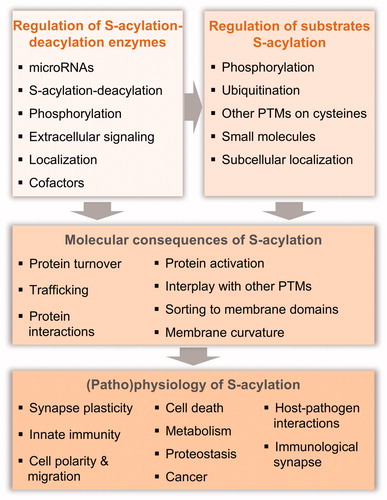
Figure 7. Regulation and physiological relevance of protein S-acylation. S-acylation can be regulated by affecting the activity of the S-(de)acylation enzymes or by direct regulation of the select S-acylation event of a given protein substrate or cysteine residue. In turn, the molecular consequences of this S-acylation can be varied and impact a broad spectrum of physiological processes (see color version of this figure at www.tandfonline.com/ibmg).