Figures & data
Figure 1. A| Protein lysine methyltransferases (PKMTs) transfer up to three methyl groups to specific lysine residues in proteins. The cofactor S-adenosyl-L-methionine (SAM) provides the methyl group. It is released after the transfer as S-adenosyl-L-homocysteine (SAH). B| The protein substrate (cyan) and SAM (orange, methyl group is colored black) bind at opposing sites of the SET domain (grey) in SET domain PKMTs. The target lysine (pink) is inserted into a narrow tunnel, where the lysine is deprotonated and oriented for the methyl group transfer (image created using simulation results of PDB 6VDB (Schuhmacher et al. Citation2020)). C| The methyl group is transferred using a bimolecular nucleophilic substitution (SN2) mechanism, in which multiple geometric criteria need to be fulfilled to reach the transition state.
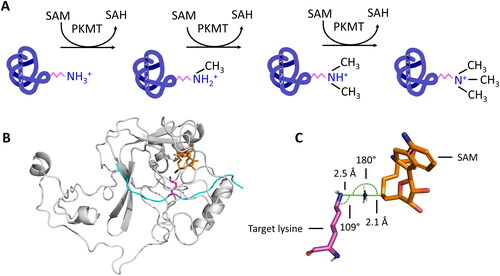
Figure 2. Molecular dynamics (MD) and hybrid quantum mechanics/molecular mechanics (QM/MM) simulations have been applied to investigate protein properties. A| In MD simulations, atoms are connected via spring-like bonds. The bonded forces comprise bond stretching, angle bending and dihedral torsion. Non-bonded interactions consist of electrostatic and van der Waals forces. Electrostatic forces are applied between fully or partially charged atoms. Van der Waals forces are described using the Lennard-Jones potential. B| In QM/MM simulations, the simulated system is divided into a QM region (blue transparent sphere) and a MM region. In the MM region, forces are calculated as for MD simulations using force fields. In the QM region, bonds can be broken or formed, and atoms are treated using quantum mechanics. In applications with PKMTs, the active site has been treated using QM methods to cover the methyl group transfer, the rest of the enzyme and bulk solvent was treated with MM (image created using simulation results of PDB 5V21 (Zhang et al. Citation2017)). C| Phylogenetic tree of SET domain-containing PKMTs. Modified from (Wu et al. Citation2010; Richon et al. Citation2011; Luo Citation2018).
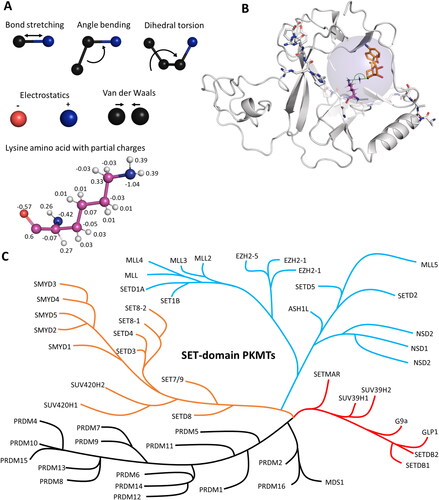
Figure 3. Cartoon representation of SET and 7BS domain PKMT architectures. A| SET domain-containing PKMT G9a complexed with the H3K36 substrate peptide (cyan with the target lysine in pink), and cofactor SAM (orange, PDB 5JIY (Jayaram et al. Citation2016)). SET domain-containing PKMTs incorporate Zn-ions for structural stability in their AWS (Associated with SET, magenta), post-SET (yellow) or MYND (rose) domain depending on the enzyme (Dillon 2005, Wu et al. Citation2011). However, the Zn-ions are not involved in catalysis or conformational changes and they are not shown explicitely in protein structures presented in this review. B| SETD2 complexed with the H3K36 substrate peptide, and cofactor SAM (PDB 5JLB (Yang et al. Citation2016)). The autoinhibitory loop (rose) is in an open position to accommodate the protein substrate. C| MLL1 SET domain (white) associated with WDR5 (green), RbBP5 (light blue), ASH2L (rose) and DPY30 (cyan) bound to a nucleosome core particle (PDB 6PWV (Park et al. Citation2019)). MLL1 SET domain complexed with the H3K4 peptide (cyan, wiht the target K in pink) (PDB 6UH5 (Hsu et al. Citation2019)). D| SMYD2 complexed with the ERα substrate peptide (PDB 4O6F (Jiang et al. Citation2014)) showing the the bilobal or clamshell-like structure and the MYND domain. E| 7BS PKMT DOT1L and cofactor SAM (PDB 1NW3 (Min et al. Citation2003)). The architecture consists of a DOT1L specific region (magenta), a seven-beta sheet rossman fold (white) and a ubiquitin interaction region (green).
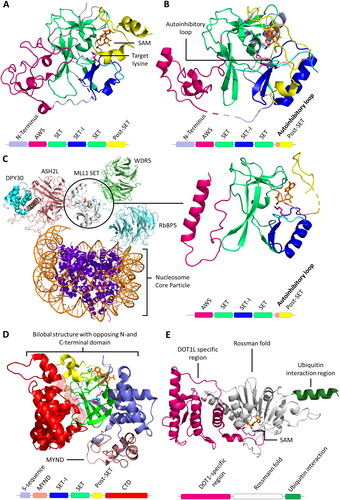
Figure 4. A| Structure representation of lysine and lysine analogues and their capability to function as PKMT methyl group acceptors. B| Target lysine deprotonation is obligatory for the PKMT catalyzed methyl group transfer. The protonated target lysine (pink, sticks) is oriented by SET7/9 Y335 (white, sticks), the water channel is already present (red spheres, prepared using PDB 1XQH (Chuikov et al. Citation2004)). C| The lysine proton is transferred to the nearby water molecule. D| After lysine deprotonation, the SAM-methyl group is rapidly transferred to the deprotonated target lysine thereby preventing the reprotonation. The excess proton is transferred into the bulk solvent.
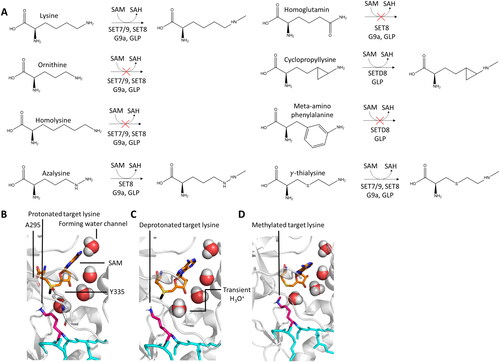
Figure 5. PKMTs transfer a defined number of methyl groups to their lysine target (pink, sticks). A| Schematic representation of a free energy profile showing a possible first methyl transfer (black line) and an energetically unfavorable second transfer (red line). B| Restricted second methylation because of a disrupted water channel and blocked lysine deprotonation of monomethylated target lysine (green, sticks, PDB 1XQH). C| The SN2 TS cannot be adopted if a monomethyl substrate is present. D| The F/Y-switch position controls the product specificity of certain PKMTs. Phenylalanine (white, sticks) provides more space in the active site allowing to accommodate a dimethyl product (pinks, sticks), while the additional hydroxyl group of a tyrosine leads to sterical clashes preventing formation of the dimethylated product. E| Position of the tyrosine residues 245, 305, 335 in the SET7/9 active site discussed in the main text.
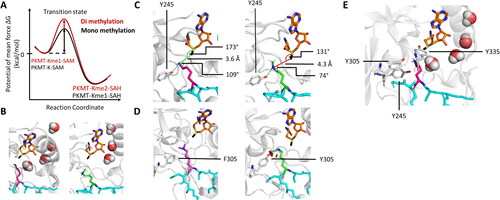
Figure 6. SETD2 has a ∼ 100-fold higher activity towards an artificially designed ssK36 peptide substrate. A| SPOT peptide array with the 15-residue long H3K36 peptide sequence as starting sequence, incubated with SETD2 and radioactively labeled SAM. Positions are individually mutated to any other amino acid except tryptophan and cysteine. At several positions non-natural amino acids are preferred in the substrate peptide. B| Quantification of the peptide array methylation data generates a PKMT specific specificity profile showing the preference for each position. C| Combination of preferred residues led to the generation of a super-substrate (ssK36) peptide (black, sticks) sequence, which differs at 4 positions (orange, sticks) from the canonical H3K36 peptide sequence (cyan, sticks). D-G| MD and sMD simulation snapshots of SETD2 (white, cartoon) interacting with the ssK36 peptide (black, cartoon). D| Crystal structures show the ssK36 peptide in the SETD2 binding cleft, where special interactions of SETD2 with ssK36 residues are observed (prepared using PDB 6VDB as template (Schuhmacher et al. Citation2020)). E| MD simulation of the H3K36 and ssK36 peptides in solution with subsequent backbone conformation-based clustering show that the ssK36 peptide preferably adopts a hairpin-like conformation with the target lysine facing outwards. The H3K36 peptide (cyan, cartoon) prefers an extended conformation. F| In sMD simulations, hairpin-like shaped peptides docked more often successfully in the SETD2 binding cleft, establishing more TS-like conformations. G| After binding, the hairpin conformations unfold in an extended conformation with contacts spreading gradually from the middle section. A-C| Taken from (Schuhmacher et al. Citation2020; Schnee et al. Citation2022) with permission.
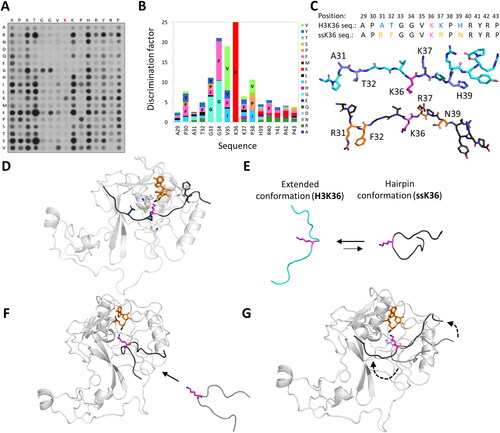
Figure 7. In the binary PKMT-SAM structure, the placeholder residue occupies the target lysine channel. A| Alignment of the autoinhibitory loops (AL) of PKMTs with known placeholder residue (bold). B| Cartoon and sticks representation of ASH1L (PDB 4YNM (Rogawski et al. Citation2015)) with S2259 acting as the placeholder residue and the AL in closed position. A target lysine taken from a superposition is shown in fade violet in the target lysine channel to visualize the overlap with the placeholder residue. SAM is shown in orange and the methyl group in black. C| In SETD2, the placeholder residue R1670 (rose, sticks) can adopt multiple conformations. If no peptide is bound, the AL is in a closed position and R1670 occupies the target lysine channel (PDB 4H12 (Zheng et al. Citation2012)). D| In a half-open position, the AL starts to lift and R1670 turns outwards (PDB 5JLE (Yang et al. Citation2016)). E| If a peptide substrate (cyan, target lysine in pink) is bound, the AL is in an open position and R1670 is solvent exposed. The post-SET loop (yellow, cartoon) is closed on top of the bound peptide (PDB 5JLB).
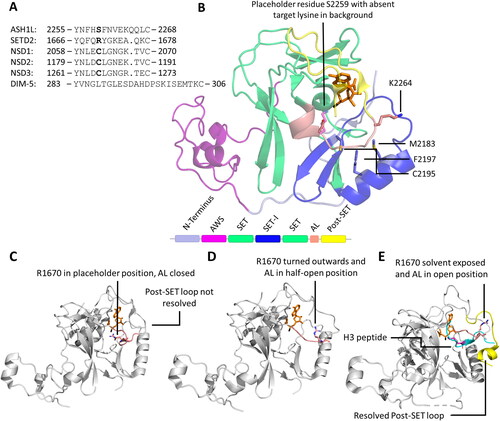
Figure 8. Possible mechanism of SETD2 histone tails binding. A| Hypothetical strucutre of the histone tail (modified from PDB 7EA5 (Liu et al. Citation2021)) interacting with the DNA and forming a hairpin-like conformation with the target lysine facing outside. B| First contacts between H3K36 and H3V35 and the SETD2 AL (modified from PDB 6VDB) could trigger conformational changes in the AL and R1670 opening the SETD2 binding cleft.
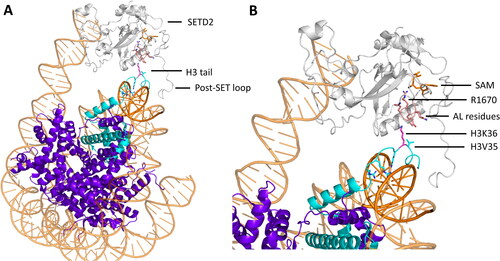
Figure 9. NSD2 cancer mutants E1099K and T1150A result in an increased methylation activity. A| Crystal structure of NSD2 E1099K, T1150A (sticks, red) complexed to a nucleosome binding the H3 tail (cartoon, cyan, PDB 7E8D (Sato et al. Citation2021)). E1099K binds the nucleosome DNA backbone (cartoon, orange), which was suggested to be the reason the increased activity. B-C| Mechanism proposed for the increased activity of T1150A and E1099K by remodeling the H-bonds around the AL (cartoon and sticks, rose) resulting in an easier uplifting of the AL. The placeholder residue C1181 is in an open position. B| H-bond network in NSD2 WT (PDB 5LSU (Tisi et al. Citation2016)). C| H-bond network in NSD2 T1150A, in which the contact with D1182 is lost and the AL is lifted (image created using simulation results as described in Sato et al. (Citation2021)). D| H-bond network in NSD2 E1099K where K1099 forms a novel salt bridge with D1125 which is accompanied by decreased salt bridge formation between D1123 and K1152, since D1123 is in a polar connection with K1124 (image created using simulation results as described in Sato et al. (Citation2021)).
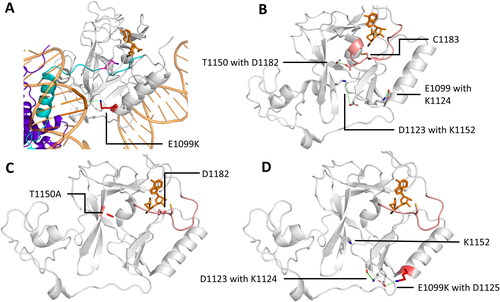
Figure 10. Besides the increasing the methylation activity, the T1150A cancer mutation causes a change in the product specificity of NSD2 from a di- to a trimethyltransferase. A-B| sMD simulations showed that the NSD2-H3K36me2 complex was not able bind SAM in a productive conformation, but the T1150A mutant-H3K36me2 complex was. Shown are representative snapshots from the sMD simulations, where the dashed line indicates the trajectory of the SAM molecule. C| Contacts (dashed red lines) established by T1150 (sticks, white) with Y1092 and L1120 (sticks, green) lead to a compact active site volume (gray spheres) restricting its activity to dimethylation. These contacts are missing for A1150 (sticks, red) resulting in a more spacious active site (blue spheres). Taken and modified from (Khella et al. Citation2023) with permission.
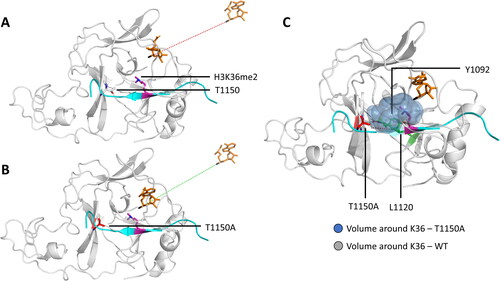
Figure 11. A| Alignment of the different domains in SMYD enzymes. B| Cartoon representation of SMYD2 complexed with the 10 amino acid long peptide ERα in a U-shape conformation (PDB 4O6F (Jiang et al. Citation2014)). Different domains are colored as in the alignment. C| Cartoon representation of SMYD enzymes 1-5. The color code is as in the domain alignment: SAM is colored orange, and shown as sticks. SMYD1 (PDB 3N71 (Sirinupong et al. Citation2010)) is shown in an open CTD (pink) conformation. SMYD2 (PDB 3RIB (Xu, Zhong, et al. Citation2011)) is shown in an intermediate CTD (magenta) position. SMYD3 (PDB 3PDN (Sirinupong et al. Citation2011)) in a closed CTD (red) conformation. Black arrows indicate the directions the CTD is expected to move based on the starting conformation displayed. SMYD4 (AlphaFold model based on UniProt Q8IYR2) with the characteristic TPR domain (white). SMYD5 (AlphaFold model based on UniProt Q6GMV2) in which part of the CTD is replaced by a poly E-tail (red). D| Results of crystal structures of with SMYD3. Binding of SAM (orange, sticks) into its binding pocket in SMYD3 causes residues F183, S202 and Y239 (green, sticks) to have increased solvent accessible area (PDB 3RU0 (Foreman et al. Citation2011)). F183, S202 and Y239 are part of the target lysine channel. E| SMYD3 shows an increased activity towards the MAP3K2 peptide (cyan) compared to the VEGFR1 peptide (dark green, PDB 5HQ8 (Van Aller et al. Citation2016) and 5EX3 (Fu et al. Citation2016), modified). The molecular mechanism for this focuses on the -2 position of the peptide (in relation to the K260 or K831 target sites in MAP3K2 or VEGFR1, respectively), where MAP3K2 carries F258 (cyan, sticks) which creates a hydrophobic patch (blue circle) with SMYD3 residues (blue, sticks). This effect is reduced for VEGFR1, which has a L258 (dark green, sticks) at this position. Moreover, MAP3K2 T263 and Y264 (cyan, sticks) interact with SMYD3 D332 (red, sticks) causing the peptide to bend into a hairpin conformation while VEGFR1 contains G834 that does not form a contact with SMYD3.
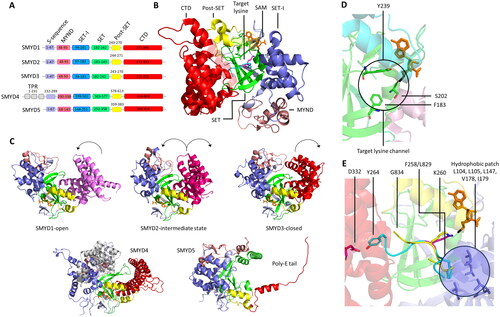
Figure 12. Structural organization of the MLL1 SET-WRAD complex. A| Structure of the MLL1 SET domain (white) associated with WDR5 (green), RBBP5 (light blue), ASH2L (rose) and DPY30 (cyan) bound to a nucleosome core particle (NCP, purple) (PDB 6PWV). B| Distinct features of the interaction between RbBP5 and the nucleosome like the quad-R residues, A-loop, I-loop. C| The ASH2L IDR interacts with the NCP thereby facilitating the binding of the complex. D| MLL1 SET-WRAD binds to the NCP (grey) in two distinct binding modes. In the first binding mode, MLL1 SET (dark green) is positioned at the dyad barely interacting with the NCP (PDB 6PWV). Main interaction sites between MLL1 SET-WRAD complex and NCP are established by RbBP5 and ASH2L (WRAD colored green). In the second binding mode, RbBP5 (WRAD colored red) rotates clockwise and MLL1 SET (magenta) is positioned on top of the NCP disk, binding to the H3 histone tail (spheres, cyan, PDB 6KIX (Xue et al. Citation2019)). E| Ubiquitination (yellow) of H2BK120 leads to shift towards the second binding mode of the MLL1 SET (white)-WRAD complex (red, PDB 6KIU (Xue et al. Citation2019)). F| The yeast MLL1 homologue Set1 (white) binds an H2BK120 ubiquitinated NCP in the second binding mode (PDB 6UH5). Histone tail residues H3A1-H3R8 (cyan) are resolved and the target lysine K4 (pink) is correctly bound in the SET domain active site. The H3 tail reaches out from the NCP and is not resolved due to its high flexibility and dynamic behavior. Potentially, it wraps around the nucleosomal DNA to establish a stable binding in the Set1 SET domain.
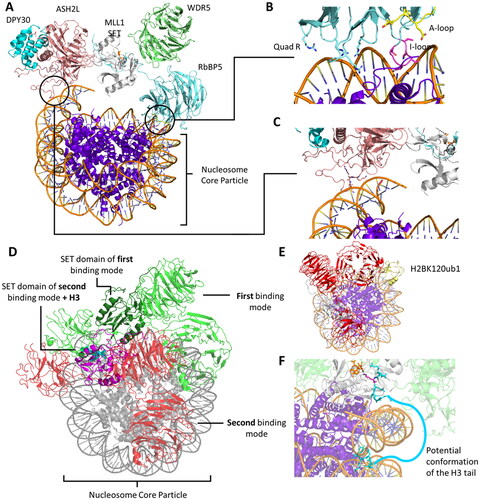
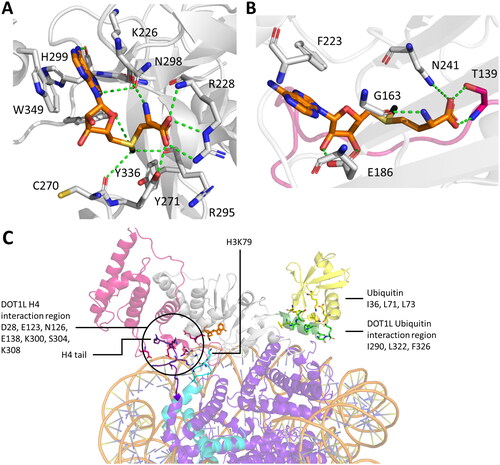
Figure 13. Different positioning of SAM in the cofactor binding sites of SET domain and 7BS PKMTs. A| In SET domain-containing PKMTs, SAM is positioned in a bent information, with the sugar ring hydroxyl groups solvent exposed (PDB 3F9W (Couture et al. Citation2008)). B| In the 7BS PKMT DOT1L, SAM is positioned in an extended conformation, with the nicotine amid ring solvent exposed (PDB 1NW3). C| DOT1L requires interaction with H2BK120ub1 (yellow) and the H4 tail (purple) for full catalytic efficiency (PDB 6NQA (Worden et al. Citation2019)). Shown are the residues of DOT1L (green, sticks) interacting with the ubiquitin (yellow, sticks), as well as the residues of DOT1L (white and magenta, stick) interacting with the H4 tail (purple, sticks). The H3 protein with the target K79 is shown as sticks in cyan, whereas the other histone proteins are colored purple.