
Figures & data
Figure 1. Hypothesized model.
Figure 1 shows the hypothesized relationships of exposure to SMIs' content about COVID-19 on SMIs at T1, SMIs as source of information for COVID-19 at T2 and SMIs as role model for COVID-19 at T2 moderated by institutional mistrust at T1. It also shows the hypothesized relationships of SMIs as source of information and role model for COVID-19 at T1 and low risk perception at T2 as well as COVID-19 vaccination intention at T2 moderated by SMIs’ noncompliance with COVID-19 measures at T1.
Figure 2. Results of hypothesized relationships.
Figure 2 shows a significant positive interaction effect of exposure to SMIs’ content about COVID-19 at T1 with institutional mistrust at T1 on SMIs as source of information for COVID-19 at T2 and SMIs as role model for COVID-19 at T2. Furthermore, it shows a significant negative interaction effect of perceiving SMIs as information source for COVID-19 at T1 with SMIs’ noncompliance with COVID-19 measures at T1 on COVID-19 vaccination intention at T2.
Figure 3. Effect of exposure to SMIs’ COVID-19 content (T1) on the importance of SMIs as information source (T2) moderated by institutional mistrust (T1).
Panel A: Interaction plot, consisting of three lines, showing how the positive relationship of exposure to SMIs’ COVID-19 content with the importance of SMIs as a source of information is strongest at 1 standard deviation above the mean, weaker at the mean, and weakest 1 standard deviation below the mean of institutional mistrust. Panel B: Line graph depicting Johnson-Neyman intervals of significance, showing that the slope of using SMIs as information source is significant at medium and high levels of institutional mistrust (at scores above 2.10).
Panel A shows the effect of exposure to SMIs’ COVID-19 content on the importance of SMIs as a source of information for moderator scores 1 SD below and above the mean. Panel B indicates Johnson-Neyman intervals of significance. Shaded regions indicate 95% confidence intervals.
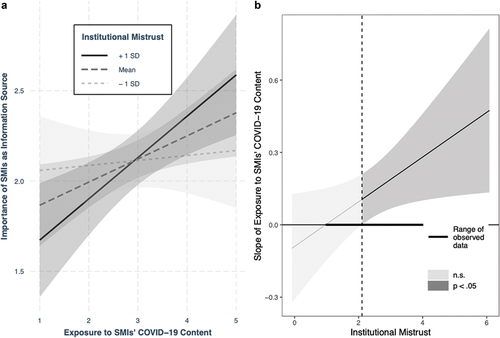
Table 1. Results of autoregressive stepwise multiple regression models.
Figure 4. Effect of exposure to SMIs’ COVID-19 content (T1) on the perception of SMIs as role model (T2) moderated by institutional mistrust (T1).
Panel A: Interaction plot, consisting of three lines, showing how the relationship of exposure to SMIs’ COVID-19 content with perception of SMIs as role model is positive at 1 standard deviation above the mean of institutional mistrust. The regression line is still indicating a positive association at the mean of the moderator, but a negative association at scores 1 standard deviation below the mean. Panel B: Line graph depicting Johnson-Neyman intervals of significance, showing that the slope of using SMIs as information source is significant at medium and high levels of institutional mistrust (at scores above 2.54).
Panel A shows the effect of exposure to SMIs’ COVID-19 content on the perception of SMIs as role model for moderator scores 1 SD below and above the mean. Panel B indicates Johnson-Neyman intervals of significance. Shaded regions indicate 95% confidence intervals.
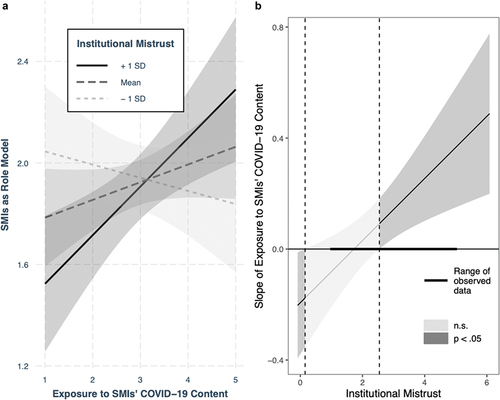
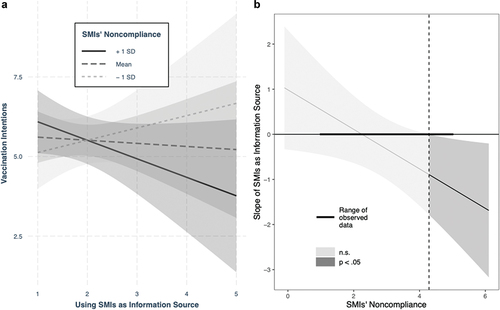
Figure 5. Effect of perceiving SMIs as information source about COVID-19 (T1) on vaccination intentions (T2) moderated by SMIs’ noncompliance (T1).
Panel A: Interaction plot, consisting of three lines, showing how the relationship of using SMIs as information source with vaccination intentions is positive at 1 standard deviation above the mean of SMIs’ noncompliance. The regression line is indicating a slight negative association at the mean of the moderator and a stronger negative association at scores 1 standard deviation below the mean. Panel B: Line graph depicting Johnson-Neyman intervals of significance, showing that the slope of using SMIs as information source is significant at high levels of SMIs’ noncompliance (at scores above 4.29).
Panel A shows the effect of perceiving SMIs as information source on vaccination intentions for moderator scores 1 SD below and above the mean. Panel B indicates Johnson-Neyman intervals of significance. Shaded regions indicate 95% confidence intervals.
Supplemental material