Figures & data
Table 1. Demographic information of the study sample including number (N) and percentage (%) of participants representing each category.
Table 2. Correlations between variables with their means and standard deviations.
Table 3. Regression analysis for predictors of physical distancing behavior, standardized beta coefficients, and T-statistics.
Figure 1. Interaction effects of descriptive norms and outcome expectations on physical distancing behaviors.
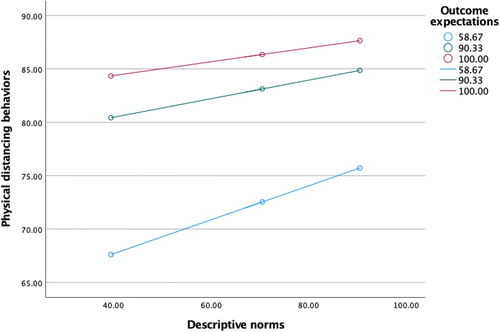
Figure 2. Interaction effects of injunctive norms and outcome expectations on physical distancing behaviors.
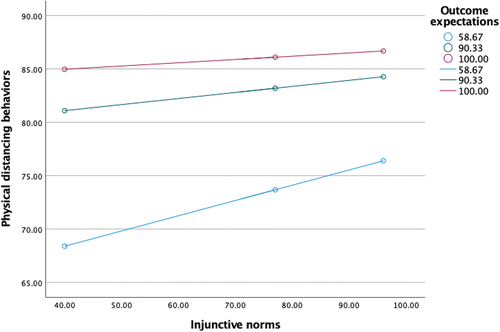
Figure 3. Interaction effects of descriptive norms and group orientation on physical distancing behaviors..
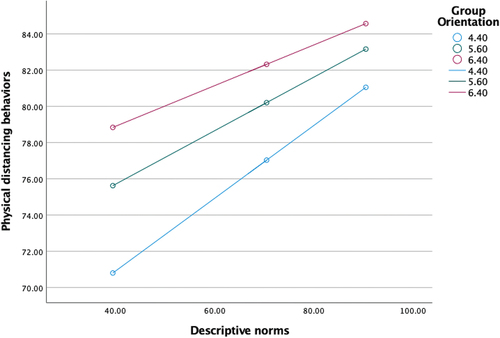
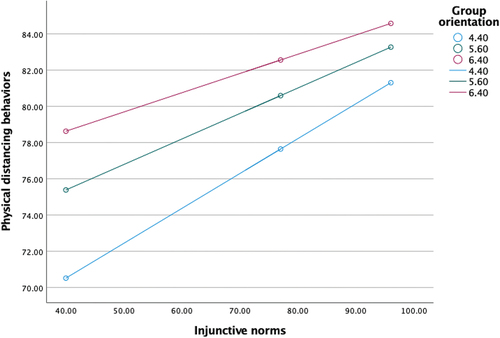
Figure 4. Interaction effects of injunctive norms and group orientation on physical distancing behaviors.