
Figures & data
Figure 1. Graphical Representation of the Model to Examine Emotional Synchrony.
Note. The figure is a graphical representation of the multilevel model used to examine hypotheses H3a and H3b (EquationEquations 2 (2) (2) –Equation5(5) (5) ). The rectangles represent manifest variables, the circles represent latent variables, the two headed arrows represent variances and covariances, the one-headed arrows represent regressions, and where the triangles represent vectors of 1 that invoke intercepts. In this graphical representation of the model that was fit to the observed data, the intercepts (β0d) and slopes (β1d) of the within-dyad relations, where listeners’ time-varying emotion sentiment are regressed on users’ time-varying sentiment, are shown as small circles on their associated arrows (i.e., the random effects). These parameters are then projected and summarized as Overall Listener Emotion Sentiment and Emotional Synchrony factors that are then regressed at the between-dyad level on the Trait User Sentiment and Affect Change variables and their interaction. The relations of interest for testing H3a (γ10, the prototypical level of emotional synchrony) and H3b (γ10 commonly used emojis we12, the relation between differences in affect change and emotional synchrony) are shown as bold lines.
Figure 2. Change in Users’ Affective State from Pre- to Post Conversation.
Note. Users’ pre- and post-conversation affective state is plotted along the x-axis, with lines connecting individual user’s reports. Each small dot represents an individual’s report of affective state, with the dots (i.e., affective state reports) being jittered slightly to reduce the overlap of points and facilitate visibility. The lines connecting pre- and post-conversation affective state represent change in affective state, with thicker lines indicating where more individuals followed a particular trajectory.
Table 1. Results from regression examining change in users’ affective state.
Figure 3. Results from Regression Model Predicting Affective State Change from Language Style Matching.
Note. The figure depicts the association between language style matching and affective state change (H2b).
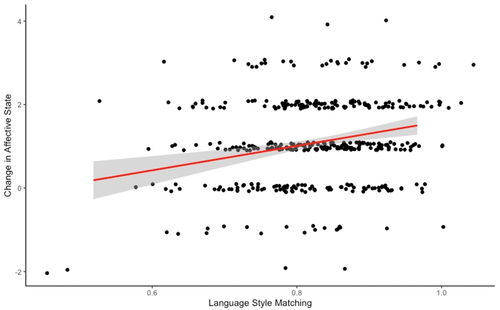
Table 2. Results from regression examining the association between lsm and change in users’ affective state.
Table 3. Results from multilevel model examining the association between users’ and listeners’ emotional sentiment and change in users’ affective state.
Supplemental material