243
Views
0
CrossRef citations to date
0
Altmetric
Correction

Correction

Pages 1072-1075 | Received 09 May 2023, Accepted 12 May 2023, Published online: 09 Jun 2023

Figures & data

Figure 1. CONSORT diagram showing the flow of participants through each stage of the study.

Figure 1. CONSORT diagram showing the flow of participants through each stage of the study.

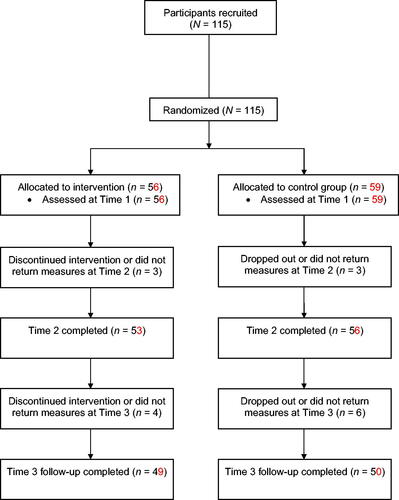
Table 4. Main group, time, and interaction effects (group × time) (n = 115).

Table 3. Analysis of simple effects on all measures between intervention and control group at each time point (n = 115).

Reprints and Corporate Permissions

Please note: Selecting permissions does not provide access to the full text of the article, please see our help page How do I view content?

To request a reprint or corporate permissions for this article, please click on the relevant link below:

Academic Permissions

Please note: Selecting permissions does not provide access to the full text of the article, please see our help page How do I view content?

Obtain permissions instantly via Rightslink by clicking on the button below:

If you are unable to obtain permissions via Rightslink, please complete and submit this Permissions form. For more information, please visit our Permissions help page.