
Figures & data
Table 1. Means (SDs) by different types of behavior under low-high pressure.
Figure 1. The left picture is the VR shooting task in the low-pressure scene (the left green area in the scene is the scoreboard), the right picture is the VR shooting task in the high-pressure scene (the left green area in the scene is the scoreboard, and the right green area is the bonus).
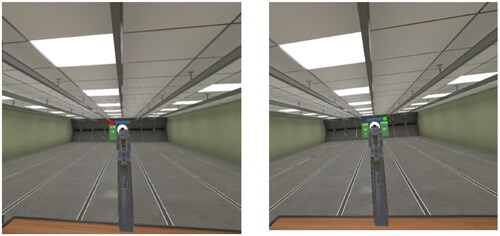
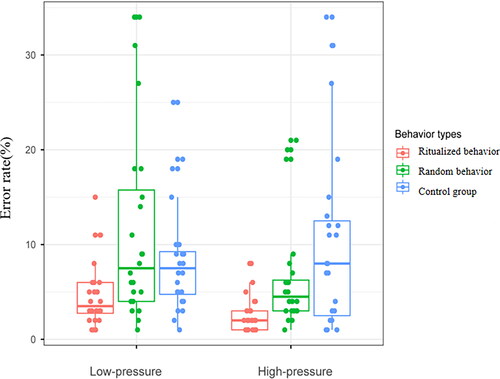
Figure 2. Low-pressure and high-pressure Mean error rates for different behavior type.
Note: Each group shows the computed 95% confidence region (colored area) and the observed data (colored circles and squares). This data visualization can display the dispersion of participants at each test time point (Mccabe et al., Citation2018).
Supplemental material