Figures & data
Figure 1. CAD drawing of the JCNS NDP chamber installed on the sample table of reflectometer MARIA. Cut-view.
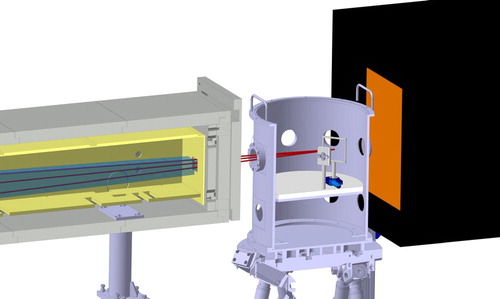
Figure 2. NDP spectrometer installed at the sample position of the reflectometer TREFF.
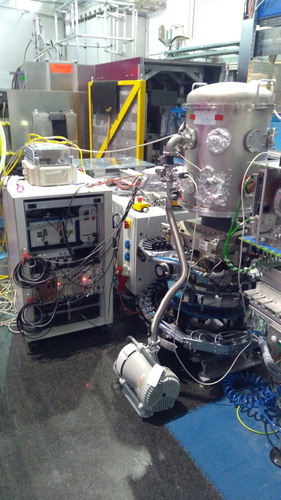
Figure 3. The interior of the NDP sample chamber with standard sample holder and single detector. Radiation shielding is removed for visibility.
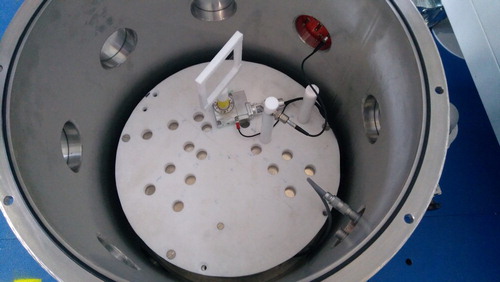
Figure 4. A block diagram of the detector signal readout chain of JCNS NDP spectrometer.
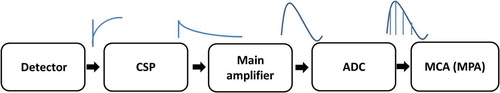
Figure 5. Spectrum collected from a 3 kBq mixed α-particle source ( Pu,
Am,
Cm) with 30 mm sample to detector distance.
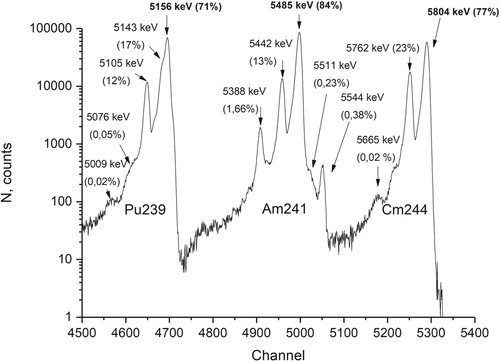
Figure 6. Spectrum collected from SRM–93a borosilicate glass. Highest energies (particles from the sample surface) are marked with dashed lines.
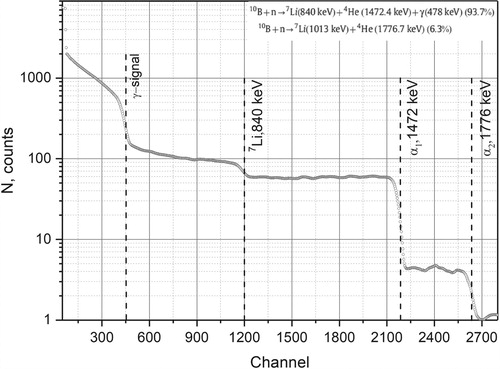
Figure 7. Inverted first derivative of the energy edge 1472 keV. Represents energy resolution of the NDP detectors system.
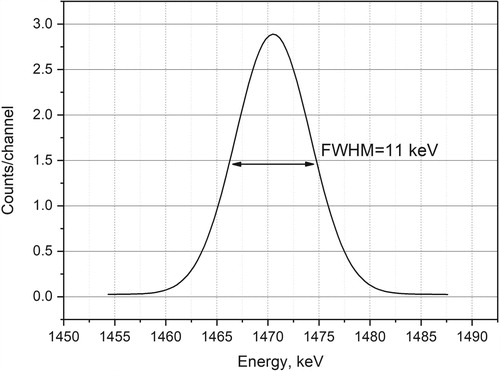
Figure 8. Achievable depth resolution for the 100 nm thin film.
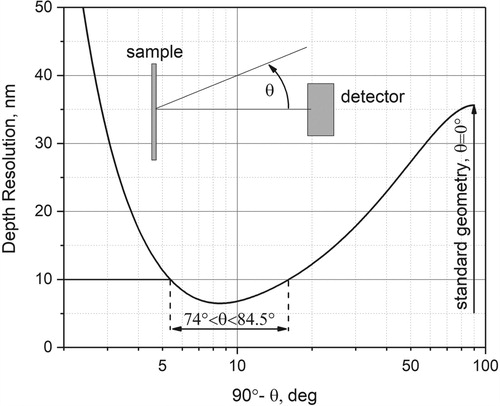
Figure 9. α-signal collected from 15 nm thick thin film (circles) and a fit (solid line).
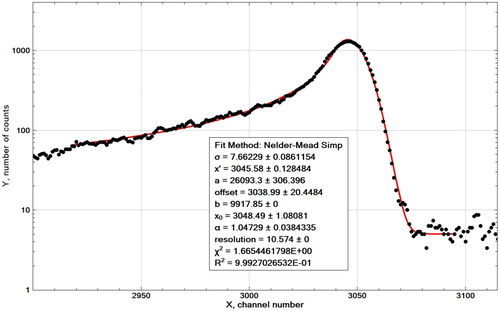
Figure 10. Unfolded NDP spectrum of SRM–2137 collected on MARIA in roughly 14h. Solid line – certified values, dots – as measured.
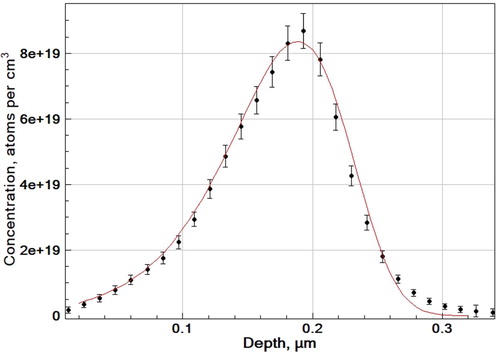
Figure 11. α-peak region of the smoothed spectrum collected for multilayer thin-film sample .
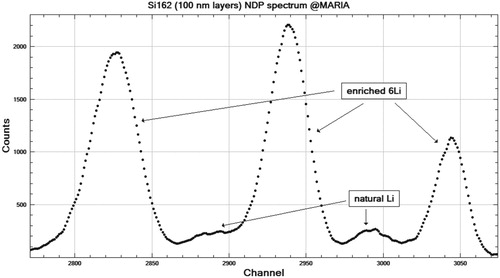
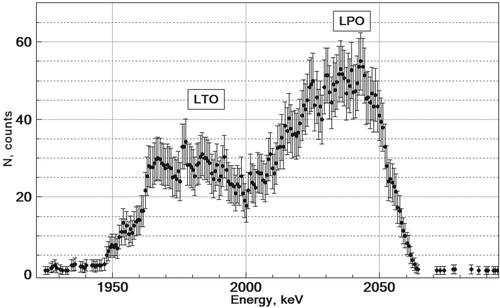
Figure 12. Smoothed spectra collected on MARIA in 90 minutes for thin films – single film (LTO) and double layer films
(LTO–LPO).
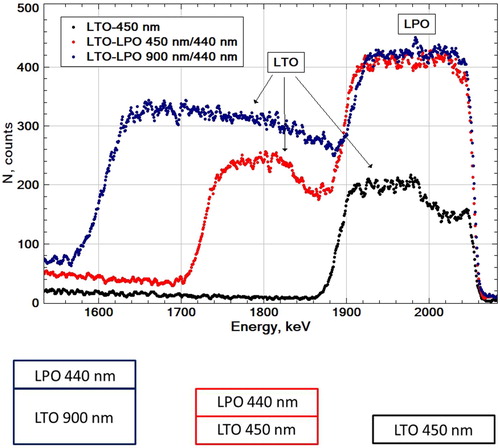
Figure 13. Unfolded Li depth profile (in relative units) of film.
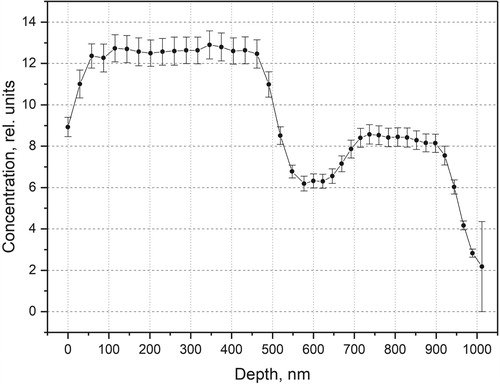
Figure 14. Smoothed spectra collected on MARIA for sample (LTO–LPO).