Figures & data
Figure 1. Schematic diagram of the experimental setup for water adsorption in the preparation chamber and electron transfer experiment in the big chamber.
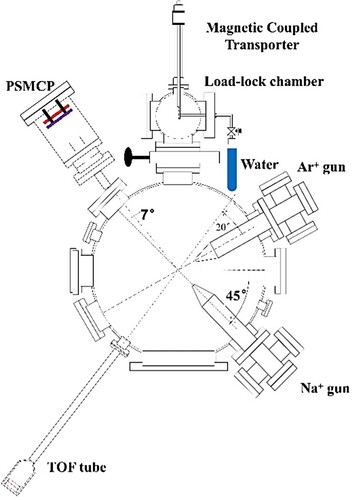
Figure 2. (a) Relative intensities of hydrogen and oxygen and the sum of them as a function of exposure time for 3-keV Ar+ scattering from a Cu(110) surface (Citation9). The solid blue line is the fitting result from the formula; (b) Relative intensities of hydrogen and oxygen as a function of temperature. The solid blue line is the fitting result from the formula.
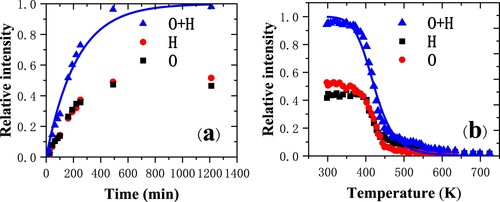
Figure 3. Time-of-flight (TOF) spectra of 3 keV Ar+ scattering from a Si(111) surface with several incident angles (Citation7). Ar(S) represents scattered Ar, H(DR), C or O(DR) and Si(DR) represent the recoil H, C or O, and Si respectively; (b) The relative intensities of hydrogen and oxygen as a function of exposure time.
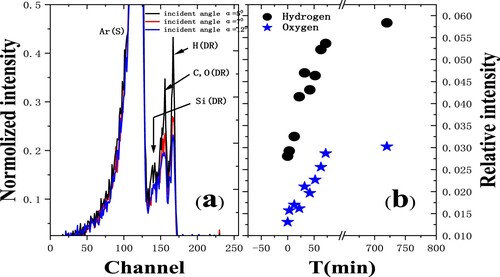
Figure 4. (a) Positive-ion fraction as a function of 1/ measured for F¯ and Cl¯ ions in grazing scattering on dissociated H2O covered Cu(110) (Citation13). The black dot line and red solid line give the best fitting. (b) Negative-ion fraction as a function of incident velocity measured for F¯ and Cl¯ ions. The black dashed and red solid lines are the calculated results for fluorine and chlorine ions, respectively. The scattering angle is fixed at 8°, and the incident and exit angles are 4°.
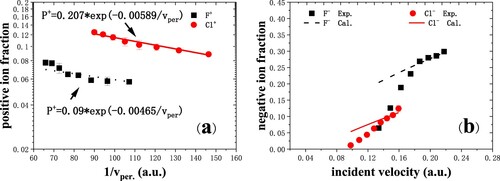
Figure 5. (a) Positive ion fraction for oxygen negative ions scattering in grazing incidence on a dissociated water-covered Cu(110) surface (black squares) (Citation19). The red solid line is the fitting result. The data of F+ fraction are cited from Ref. (Citation13) (blue circles). (b) The O¯ fraction as a function of incident velocity for specular scattering (black squares). The red solid line is the calculated result. Blue circles are the experimental data of F¯ (Citation13).
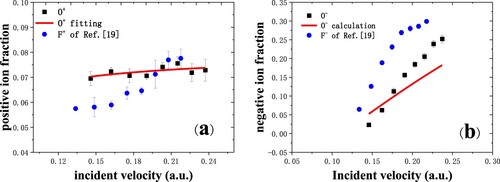
Figure 6. Schematic representation of the shifted Fermi sphere model. (a) ka < kF. (b) ka > kF. In the momentum space, the atomic resonance is represented as a shell of radius ka with some thickness, the Fermi sphere of radius kF is shifted by the parallel velocity v. Electron transfer occurs when the resonance shell overlaps with the shifted Fermi sphere (Citation13).
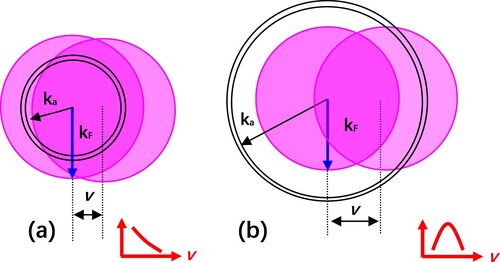
Figure 7. The Na+ neutral fractions as a function of incident velocity from clean Cu(110) and water covered Cu(110) surfaces are measured in grazing specular scattering with 7° scattering angle (Citation8). Experimental data: (▪)Cu(110) (Citation21), ()H2O/Cu(110). The black and red dashed lines are the calculated results for Cu(110) and H2O/Cu(110), respectively.
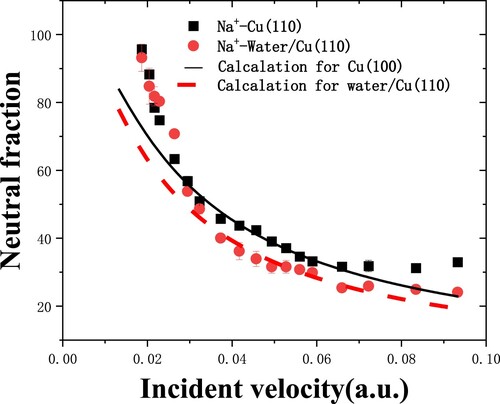
Figure 8. Positive-ion fractions as a function of perpendicular component of exit velocity, measured for 8.5–22.5 keV C- and F- in specular scattering on Si(100) surfaces with two different doping concentrations. The blue dashed and black solid lines represent the fitting results from the measured fractions for F- and C-, respectively (Citation27).
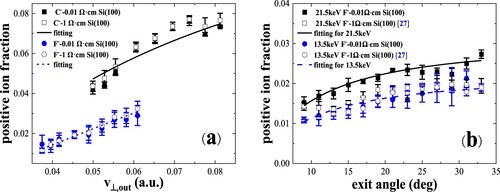
Figure 9. (a) Neutral and negative-ion fractions as a function of incident velocity are measured for 8.5–22.5 keV O-, F- in specular scattering on Si(100). The black solid and red dash lines are the calculated results from the coupled rate equations (Citation10). (b) Negative-ion fractions as a function of exit angle with respect to the surface plane are measured for 9.5 keV, 13.5 keV and 21.5 keV F-and 22.5 keV, 14.5 keV O- scattering on Si(100). The black solid, red dash and blue dot lines are the calculated results.
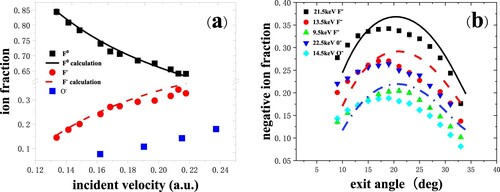
Figure 10. (a) Negative-ion fractions as a function of perpendicular component of exit velocity, measured for 8.5–22.5 keV C-, O- and F- in specular scattering on Si(100) surfaces with two different doping concentrations. Inset shows the scattering geometry. The red solid and black dashed lines represent the calculation results for C- and F-, respectively (Citation27). (b) Negative-ion fractions as a function of exit angle with respect to the surface plane, measured for 21.5, 13.5 keV F- and 22.5, 14.5 keV O- scattering on Si(100) surfaces with two different doping concentrations. The black solid and blue dot-dashed lines are the calculated results for F- including the contribution of negative ions (Citation27).
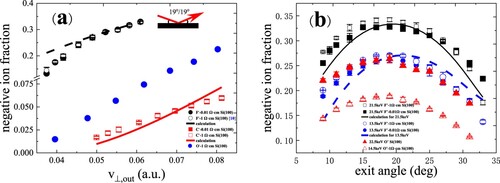
Figure 11. (a) Positive-ion fractions as a function of perpendicular exit velocity, measured for 6.5–22.5 keV C–, O– and F– in specular scattering on a water covered Si(111) surface. The black solid, red dashed and blue dash dotted curves are the fitting results (Citation17). (b) Positive-ion fractions as a function of exit angle with respect to the surface plane, measured for 22.5 keV O– and 21.5 keV F– scattering on a water covered Si(111) surface (Citation17). The black solid and blue dashed curves are the fitting results.
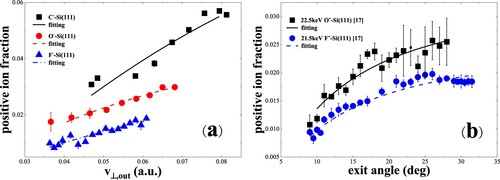
Figure 12. (a) Negative-ion fractions as a function of perpendicular exit velocity, measured for 6.5–22.5 keV C–, O– and F– in specular scattering on a water covered Si(111) surface (Citation17). The black solid, red dashed and blue dash dotted curves are the calculated results including the contribution of positive ions. (b) Negative-ion fractions as a function of exit angle with respect to the surface plane, measured for 21.5 keV F– and 22.5 keV O- scattering on a water covered Si(111) surface (Citation17). The black solid, blue dashed curves are the calculated results including the contribution of positive ions.
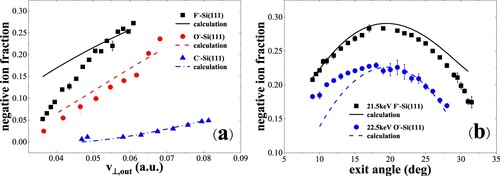
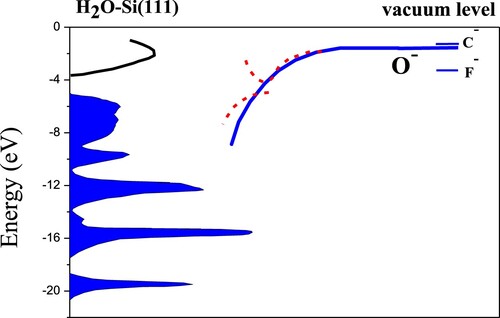
Figure 13. Schematic of the band structure of H2O-Si(111) (7 × 7) (Citation36, Citation37) as well as the energy positions of the C–, O– and F– affinity levels in front of the surface. As a representation, the solid line represents the image shift of the O– affinity level as the ion surface distance decreases. For adiabatically slow collisions, an avoided crossing structure of energy level appears as the ion-surface distance decreases due to the band gap effect (Citation33, Citation34). The first red dashed curve represents the higher lying resonance, and the second red dashed curve represents the lower lying resonance. However, for fast collisions, the effects of the narrow band gap disappear and the dominant charge transfer is nonadiabatic.