Figures & data
Figure 1. Outcrop types block diagrams. An overview of the seven distinct types of outcrop that, alone or in combination, can be used to describe any outcrop morphology. Block diagrams show the hypothetical distribution of observed trace fossils in a 3x3 unit cube, if units contain vertical (blue), horizontal (red) or no (yellow) traces. Grey shows areas which cannot be observed, and missing cubes are those lost to erosion. Pie charts show proportion of existing vertical traces (blue/grey) and horizontal traces (red/grey) which can be observed with a given outcrop style, and the relative bias towards observed vertical/horizontal traces (red/blue) given equal proportions existing within the volume. All schematics show two cases, the upper where vertical and horizontal traces occur in every unit cube, and the lower where vertical and horizontal traces occur in every alternate cube (see key). Where traces do not occur in every unit cube, only those where they are present are taken into account for proportion pie charts. Type 1 – Plateau Exposure. An example of a plateau exposure from the Potsdam Group, NY, USA with schematics. Type 2 – Stepped Plateau Exposure. An example of a stepped plateau exposure from the Mereenie Sandstone, NT, Australia with schematics. Type 3 – Stepped Exposure. An example of stepped exposure from The Loop, Tumblagooda Sandstone, WA, Australia with schematics. Type 4 – Stepped Cliff Exposure. An example of a stepped cliff exposure from Eagle Gorge, Tumblagooda Sandstone, WA, Australia with schematics. Type 5 – Cliff Exposure. An example of cliff exposure from Hawks Head Lookout, Tumblagooda Sandstone, WA, Australia with schematics. Type 6 – Overhang Cliff Exposure. An example of an overhang cliff exposure from the Lastres Formation, Asturias, Spain. Bases of overhang show horizontal trace fossils. Overhang cliff exposure typically occurs where the base of a cliff is preferentially eroded, either due to lithological differences or variable erosion pressures up the rock face, such as in waterfalls. Type 7 – Stepped Overhang Exposure. An example of a stepped overhang exposure from Grand Bank Head, Chapel Island Formation, NL, Canada with schematics. Bases of overhang show horizontal trace fossils. Note this example has undergone some structural rotation.
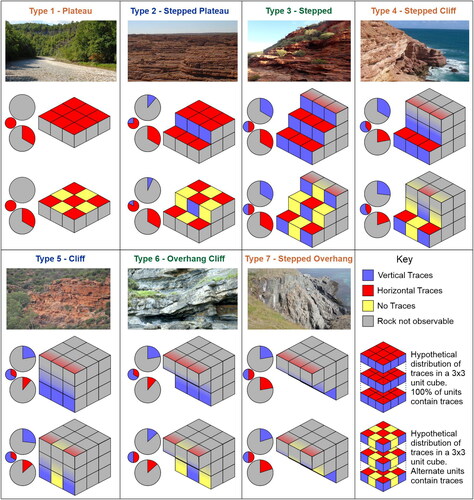
Figure 2. Two examples of non-uniform trace-fossil distribution shown in the seven different types of outcrop exposure. Only unit cubes where trace fossils are present are taken into account for proportion pie charts (hence e.g. B3 exposes 50% of potential trace fossils). (A) All outcrop types shown where vertical and horizontal traces only occur in a single bed, distribution illustrated in key. (B) All outcrop types shown where vertical and horizontal traces only occur in four unit blocks in the top right corner, distribution illustrated in key.
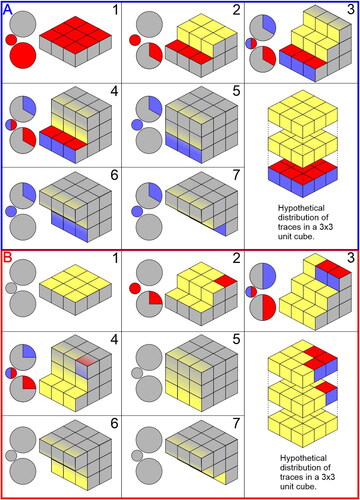
Figure 3. Examples of severely rotated outcrops, illustrating how structural effects modify the outcrop styles from the model. The amount of rotation is indicated by the arrow and numerical value on the right side of the block diagrams. (A) A cliff from the Silurian-Devonian Cowie Formation, Stonehaven, Scotland. The rock has been tilted 90°, and the bedding plane is parallel to the cliff face resulting in a rotated stepped plateau-type (2) exposure. Up-section, rotated cliff-type exposures occur on the foreshore (e.g. ). (B) Cliffs from the Silurian Old Red Sandstone of Pembrokeshire, Wales. The rock has been tilted 90°, but the cliff face is irregular leading to a rotated stepped-type (3) exposure. (C) Cliffs from the Silurian Old Red Sandstone of Pembrokeshire, Wales. The rock has been tilted 80°, and the bedding plane is perpendicular to the cliff face resulting in a rotated cliff-type (5) exposure.
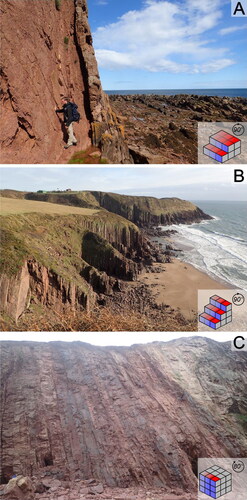
Figure 4. Examples of superficial cover of strata, resulting in reduced outcrop quality. (A) The Silurian Barlow Inlet Formation, Cornwallis Island, Canada. The outcrop is a stepped cliff-type (4) exposure, but is partially obscured by snow. This photo was taken in July, after much of the snow had melted but before the outcrop was completely exposed – approximately 20% remains under superficial cover. (B) The Ordovician Wallowbarrow Tuff Formation, Cumbria, England. The outcrop is a stepped plateau-type (2) exposure, but is partially obscured by vegetation. Before efforts were made to clear the exposure, the outcrop was partially covered in moss, and turf covered the leftmost region. This was successfully peeled back in order to make observations. This photo was taken in April. (C) Cambrian mudrock, Gaspé, Quebec, Canada. The outcrop is rotated cliff-type (5) exposure, and is partially obscured by the level of the beach and encrusting seaweed. Approximately 40% of the strata are hidden under beach cover, and a further 30% are obscured by seaweed. This photo was taken in August, so it is expected that this is towards the higher end of the beach level, and in winter more would be exposed.
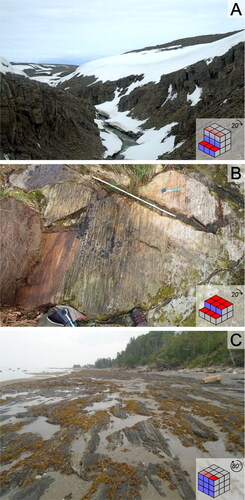
Figure 5. Examples of strata above and below the tide line, demonstrating how tidal action affects outcrop quality. (A–B) Cambrian-Ordovician Los Cabos Formation, Asturias, Spain. (A) shows part of the exposure above the tide line, the rock face is somewhat weathered and dusty, and it is difficult to make out any detail of trace fossils. (B) shows part of the same exposure below the tide line. The rock face has been polished by regular submersion, is clean, and details of trace fossils are clear. (C–D) Silurian-Devonian Cowie Formation, Stonehaven, Scotland. (C) shows part of the exposure above the tide line. The outcrop is partially concealed by the gravel beach, but is otherwise clean and unobscured by organic cover. Burrows can be clearly observed (white arrows). (D) shows part of the same exposure below the tide line. In contrast to the Los Cabos exposure, outcrop below the tideline here is almost entirely (∼90%) encrusted by barnacles, rendering the observation of trace fossils impossible. All four outcrops illustrated in this figure are rotated cliff-type (5) exposures.
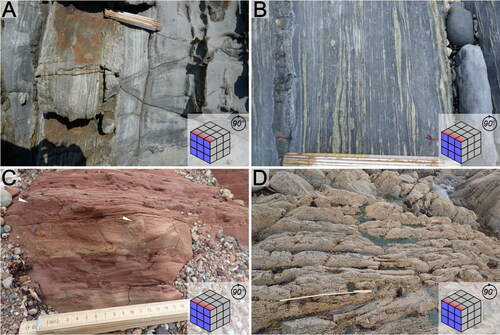
Figure 6. A case study from the Tumblagooda Sandstone of Western Australia illustrating how different outcrop morphology of the same facies associations (i.e. FA3 in A and B, and FA4 in C and D) can affect ichnodiversity measurements. Block diagrams illustrate outcrop morphology. Bars illustrate relative ichnodiversity (R.I.) of the section, with horizontal traces in red and vertical traces in blue. For reference, ichnodiversity of vertical traces in A is 1, and of horizontal traces is 2. (A) Coastal exposures of FA3 are extensive plateaus and the bases of cliffs (shown in bottom part of 6 C). The significant bedding plane area allows traces with a patchy distribution to be observed where they may not be exposed with other outcrop morphologies. (B) Inland exposures of FA3 are stepped outcrops with smaller bedding surfaces, and no horizontal traces are observed. (C) Coastal exposures of FA4 are cliff-type outcrops, and hence biased towards observations of vertical trace fossils. (D) Inland exposures of FA4 are stepped outcrops, hence any horizontal traces that are present are observable, conversely to coastal exposures.
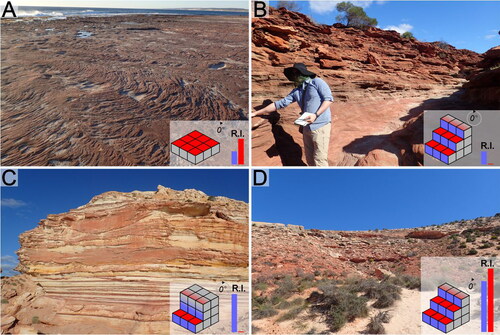
Figure 7. A case study from the Armorican Sandstone Formation of northwestern France illustrating the impact of modern tides on trace-fossil observations. Block diagrams depicting outcrop quality for the two sites can be found on . (A) Beds of the intermediate and upper member at Morgat are exposed on a cliff face and are easily accessible by foot on a beach. Note the good exposure of both vertical profiles and bed bases and tops, enhanced by the presence of local caves at the base of the cliff. The site is mostly considered a stepped exposure (). (B) Beds of the intermediate and upper member at Kerroux are only accessible at low tides, and are severely affected by the erosive action of modern waves, storms, and tides. Gaps of exposure and polishing of bed surfaces are common (), rendering the preservation potential of horizontal trace fossils low.
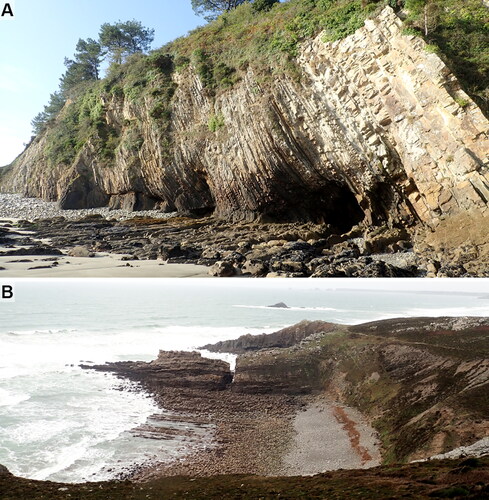
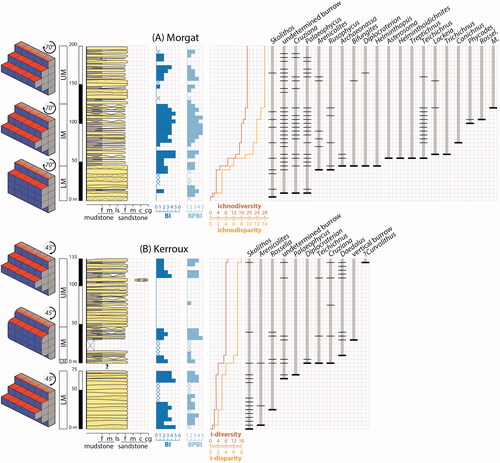
Figure 8. Sedimentologic and ichnologic data sets from two sections of the Armorican Sandstone Formation in northwestern France. LM = lower member; IM = intermediate member; UM = upper member; f/m mudstone = fine/medium mudstone; ls = limestone; f/m/c sandstone = (very) fine/medium/(very) coarse-grained sandstone; cg = conglomerate; BI = bioturbation index (i.e. vertical bioturbation); BPBI = bedding plane bioturbation index (i.e. bed surface bioturbation); Rossel. = Rosselia, and M. = Monomorphichnus. See Gougeon (Citation2023) and Gougeon et al. (Citation2023) for details on methodology for data curation. (A) Morgat hosts an excellent ichnologic data set from the intermediate member as a result of ideal stepped exposure observable on a cliff face. (B) Kerroux has a much more limited ichnologic data set, with dominance of vertical trace fossil observed. Strata at this locality are exposed within the modern tidal range, and bed surfaces of intermediate and basal upper member are continuously eroded by waves, storms, and tides, significantly reducing the preservation potential of horizontal trace fossils.