Figures & data
Figure 1. First-line R-CVP First R versus CVP.
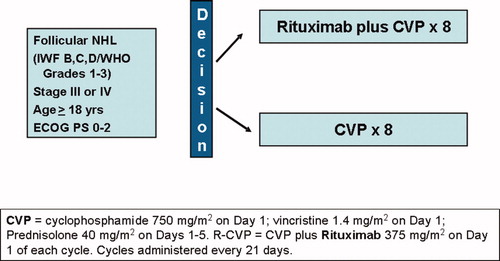
Figure 2. (a) Observed survival based on the trial data and then predicted using hazard ratios. (b) Observed progression-free survival and then predicted using hazard ratios.
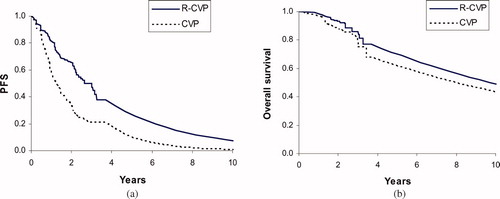
Table I. Calculation of costs of CVP
Table II. Rituximab cost calculation
Table III. R-CVP arm administration costs
Table IV. Salvage therapy regimens and costs over 6 months
Table V. Summary of base-case estimates, ranges for sensitivity analyses and quality of the evidence
Figure 3. Quality of the evidence – grading system.
Table VI. Base-case results
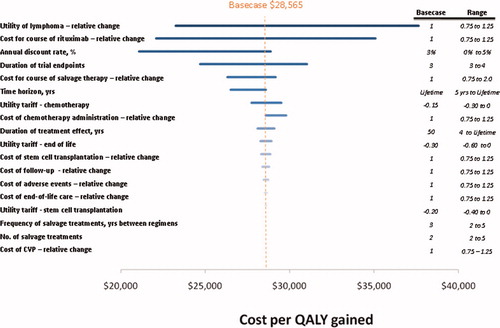
Figure 4. Sensitivity analyses.