
Figures & data
Table 1. Patient demographics in the POM + LoDEX arm at the start of C3Table Footnote*.
Figure 1. Response rates.
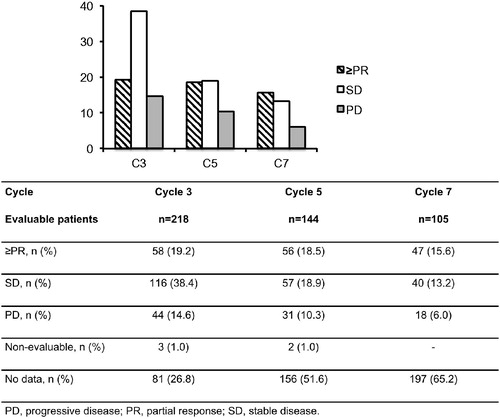
Figure 2. Responses achieved after 2 and 4 cycles of SD.
N.B. Patient numbers do not sum due to missing data points. C: cycle; D: day; PD: progressive disease; PR: partial response; SD: stable disease.
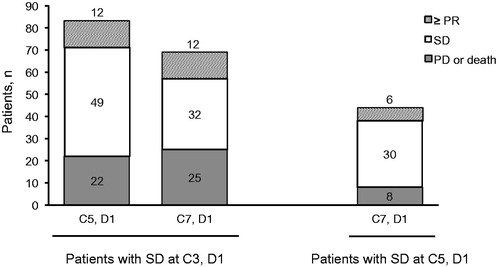
Figure 3. Landmark analysis. (A) POM + LoDEX arm; (B) Pooled POM + LoDEX and HiDEX arms.
Start of C7 analysis excludes patients with no data, or who were recorded as progressed/died prior to end of Cycle 2, 4, or 6, respectively. Performed with Kaplan-Meier method and unadjusted Cox regression model. HR: hazard ratio; OS: overall survival; PD: progressive disease; PR: partial response; SD: stable disease
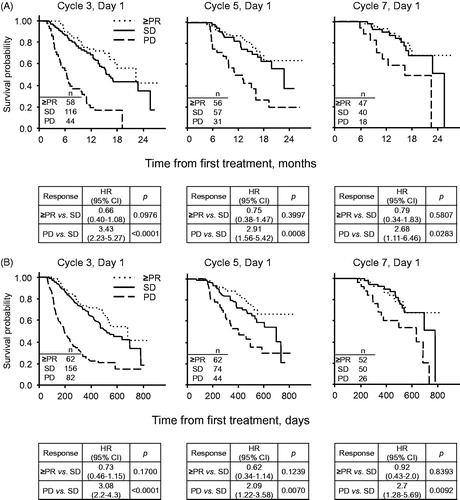
Table 2. Grade ≥3 treatment-emergent adverse events (≥5%) on day 1 of C3.