
Figures & data
Table 1. Patient demographics and characteristics.
Figure 1. Waterfall plots for best response in the (A) pivotal and (B) National Cancer Institute (NCI) trials. Blue bars represent younger patients and red bars represent older patients. For the pivotal trial, nodal responses are shown, while in the NCI trial, the composite responses including both nodal and non-nodal disease are shown. Hash marks indicate breaks in the y-axis. Patients with complete response have been normalized to −100%. It is evident that patients aged ≥60 can be found at both ends of the spectrum.
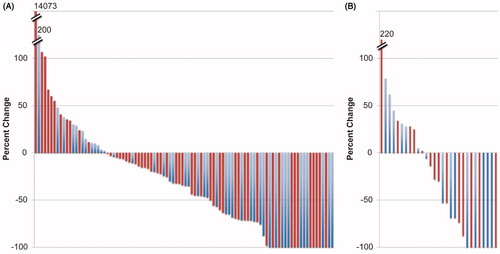
Table 2. Response rates.
Figure 2. Kinetic analysis for patients aged <60 and ≥60 years in the pivotal trial. Lymph node measurements obtained at baseline and restaging were summed at each time point and then equations were applied [Citation20] to determine growth and regression rate constants (g and d, respectively). (A) A patient with first regression and then progression, where both g and d could be determined. (B) A patient in whom only d, regression rate, could be determined. (C) A patient in whom only g, growth rate, could be determined. (D) Data are summarized in this panel. (E) Calculated rates of d, tumor shrinkage, and g, growth, are shown in box plots. As shown, there was no statistical difference between the two age groups. IQR: interquartile range.
![Figure 2. Kinetic analysis for patients aged <60 and ≥60 years in the pivotal trial. Lymph node measurements obtained at baseline and restaging were summed at each time point and then equations were applied [Citation20] to determine growth and regression rate constants (g and d, respectively). (A) A patient with first regression and then progression, where both g and d could be determined. (B) A patient in whom only d, regression rate, could be determined. (C) A patient in whom only g, growth rate, could be determined. (D) Data are summarized in this panel. (E) Calculated rates of d, tumor shrinkage, and g, growth, are shown in box plots. As shown, there was no statistical difference between the two age groups. IQR: interquartile range.](/cms/asset/d9d1a808-ebc4-4176-9840-a4964dd09fee/ilal_a_1295143_f0002_c.jpg)
Table 3. Grade ≥3 adverse events.