
Figures & data
Figure 1. Patient selection.
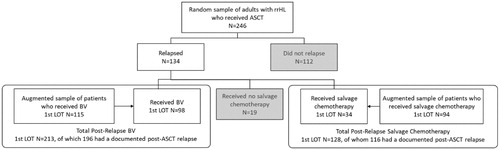
Table 1. Patient characteristics before and after propensity score weighting.
Table 2. Physicians’ choice chemotherapy regimens used in study patients.
Table 3. Best response to treatment with BV or chemotherapy, propensity djusted.
Figure 2. Propensity adjusted Kaplan–Meier curve for PFS from Initiation of postrelapse therapy.
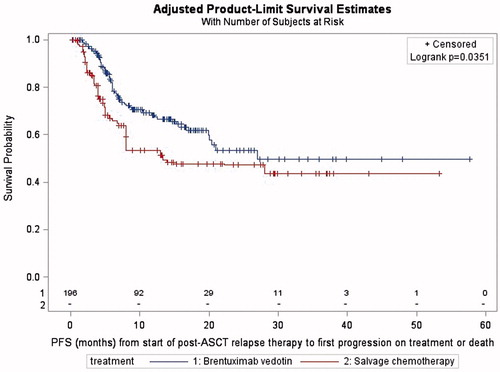
Table 4. Adverse events occurring during treatment.
Supplemental material