
Figures & data
Table 1. Patient and disease characteristics.
Figure 1. Outcome for AML patients with pre- and/or post-transplant deep sequencing MRD measurements. (A) Mutation load at 1-month pre-transplant (n = 25), and 3 months post-transplant (n = 27) in patients in morphological remission at the time of alloHCT; divided into patients with or without subsequent relapse. Negative MRD was set to 0. (B) Individual patient relapse-free survival in relation to pre- and/or post-transplant deep sequencing MRD status (n = 32). For patients in morphological remission with NPM1 MRD positivity and negativity 3 months after alloHCT, Kaplan–Meier curves for RFS are shown in (C) and OS in (D). Cutoff for MRD positivity with deep sequencing was VAF 0.02%, as described in Methods. *p < .05.
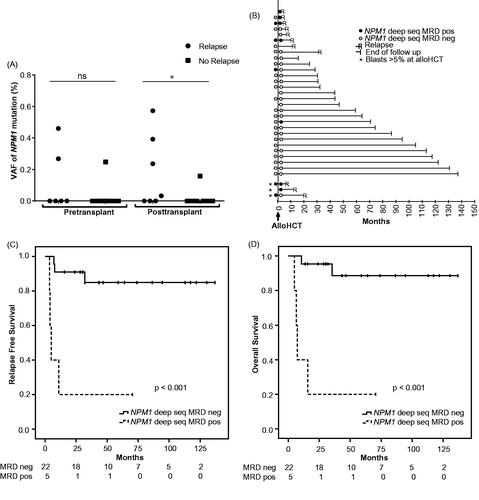
Table 2. Patient characteristics by MRD group before and after alloHCT, only patients in CR included.
Table 3. Multivariable Cox regression for RFS and OS after alloHCT.