
Figures & data
Table 1. Patient demographics and baseline disease characteristics.
Figure 1. Kaplan–Meier curves of progression-free survival by cohort. (A) Non-Richter’s with prior BTKi exposure. (B) Non-Richter’s with prior PI3Kδi exposure.
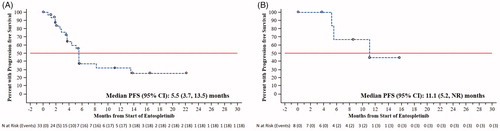
Table 2. ORR and PFS by reason for discontinuing prior BCR – IRC assessment.
Figure 2. Best percent change from baseline in tumor size (sum of the product of the diameters [SPD] of nodal or tumor mass).
![Figure 2. Best percent change from baseline in tumor size (sum of the product of the diameters [SPD] of nodal or tumor mass).](/cms/asset/7578715a-890b-4869-91bf-fa9cd17dc109/ilal_a_1562180_f0002_c.jpg)
Table 3. Treatment-emergent adverse events.