Figures & data
Figure 1. Divergent level of LAG-3 versus BTLA, TIGIT, and FCRL3 expression on total CD4+ blood T-cells from patients with Sézary syndrome. LAG-3, BTLA, FCRL3, TIGIT, and CTLA-4 expression in blood CD4+ T-cells from patients with Sèzary syndrome (SS) and healthy individuals (nml) was analyzed by flow cytometry. Left panels show significantly decreased mean fluorescence intensity (MFI) of LAG-3 (A) and increased MFI of BTLA (B), FCLR3(C) and TIGIT (D) on CD4+ T-cells from SS patients (in red) compared to CD4+ T-cells from healthy donors (in black). Each dot represents data obtained from one individual. Right panels show representative histograms of mean fluorescent intensities of LAG-3 (A), BTLA (B), FCLR3(C), TIGIT (D) and CTLA-4 (E) in CD4+ blood T-cells from SS patients (in red) and healthy individuals (in black).
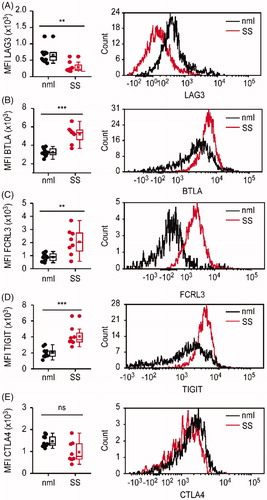
Table 1. Patients’ characteristics.
Figure 2. Expression of immune checkpoint molecules on clonal (tumor) vs. non-clonal (non-tumor) CD4+ cells in Sézary syndrome. CD4+ T-cells were isolated either from healthy donors (blue dots) or from SS patients. In blood samples from SS patients, CD4+ TCRVβ+ clonal tumor (red dots) and CD4+ TCRVβ- non-tumor (black dots) T lymphocytes were identified by TCR Vβ specific antibodies for flow cytometry. (A) Evaluation of the differences in the mean fluorescence intensity (MFI) for each marker of interest between healthy, clonal, and non-clonal T-cells. (B) Assessment of the differences in the percentage of positive for each marker of interest cells in the above defined T-cell populations.
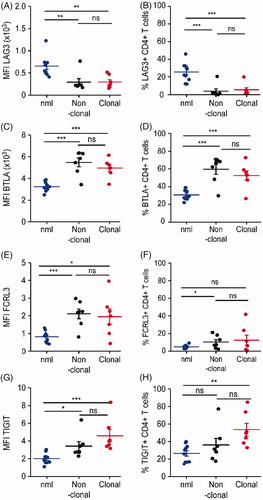
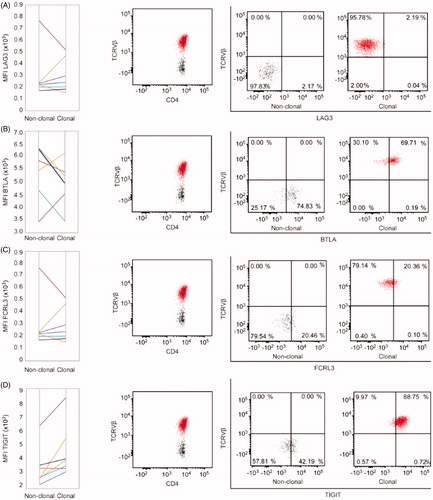
Figure 3. Intraindividual comparison of immune checkpoint molecules’ expression on clonal (tumor) vs. non-clonal (non-tumor) CD4+ cells in Sézary syndrome. (A) Pair-wise analysis of medium fluorescence intensity (MFI) in non-clonal and clonal CD4+ T-cells. Each color-indexed pair represents a data set from an individual patient with SS. (B) Representative example of flow cytometric identification of the malignant T-cell clone (red) and non-clonal T-cells (black) by staining with T-cell receptor Vβ antibodies specific for each patient’s malignant clone and evaluation of the differences in percentages of positive cells for each marker of interest between clonal and non-clonal T-cells.