
Figures & data
Table 1. Patient characteristics.
Table 2. 1st line, 2nd line and 3rd line therapies according to the period of CLL diagnosis.
Figure 1. Overall survival, defined as time between treatment start and death/last contact in years, for patients who had CLL treatment 2001 or earlier, between 2002 and 2008 or between 2009 and 2017.
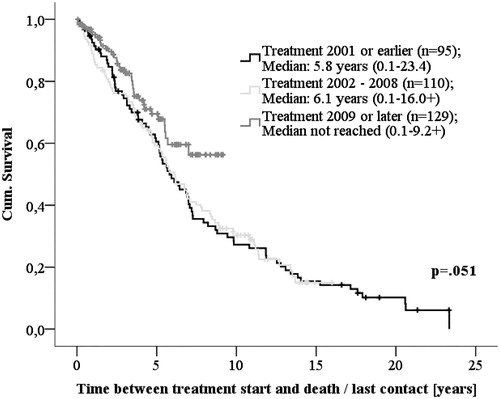
Figure 2. Overall survival, defined as time between treatment start and death/last contact in years, for patients with chemoimmunotherapy with an anti-CD20 monoclonal antibody and for patients without chemoimmunotherapy.
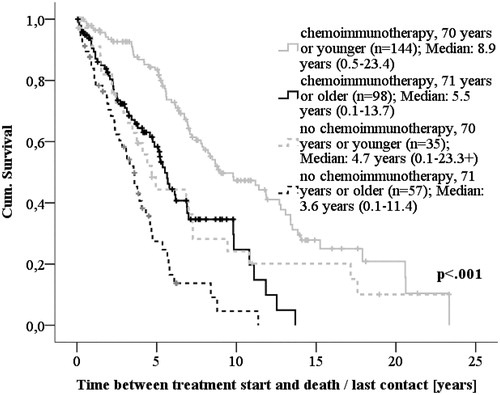
Table 3. Output of the Cox regression model.