Figures & data
Table 1. Baseline patient demographic and clinical characteristics.
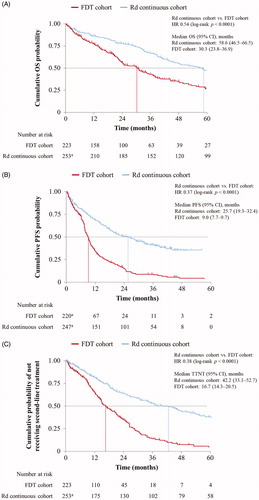
Figure 1. OS (A), PFS (B), and TTNT (C) were all significantly shorter in the real-world FDT cohort than in the MM-020 trial-derived Rd continuous cohort (Kaplan–Meier analyses). Time-dependent variables were compared between the FDT and Rd continuous cohorts using unstratified log-rank tests and Cox regression analyses, with proportionality of hazards evaluated using Schoenfeld residuals. aOne patient died before the start of the treatment. bDue to lack of progression-onset information, patients were censored at time 0; n = 3 in the FDT cohort, and n = 7 in the Rd continuous cohort. CI: confidence interval; FDT: fixed-duration therapy; HR: hazard ratio; OS: overall survival; PFS: progression-free survival; Rd: lenalidomide and low-dose dexamethasone; TTNT: time to next treatment.