
Figures & data
Table 1. Baseline demographic and clinical patient characteristics.
Figure 1. OS in patients who received consolidation. Median OS was prolonged in patients who received CPX-351 throughout induction and consolidation (black line) versus those who received 7 + 3/5 + 2 (grey line). This trend was observed in patients who received consolidation with or without HCT (table).
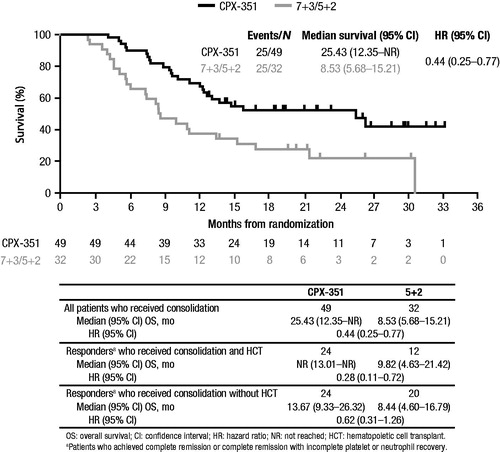
Table 2. Summary of TEAEs in patients during consolidation treatment.
Table 3. Median time to neutrophil and platelet recovery in patients who achieved remission with 1 and 2 consolidation cycles.
Table 4. Hospitalization during consolidation.
Table 5. OS by setting of consolidation administration.
Data availability statement
All relevant data are provided within the manuscript and supporting files. The study protocol and statistical analysis plan are available as online supplemental content for Lancet JE, et al. JCO. 2018;36(26):2684-2692.