
Figures & data
Table 1. Baseline demographics and clinical characteristics of HRQoL-evaluable patients.
Table 2. Mean (SD) HRQoL scores at baseline for the HRQoL-evaluable population.
Figure 1. Mean observed scores for the QLQ-C30 domains in the IFM 2009 trial compared with the general population of: global QoL (a); physical functioning (b); and role functioning (c).a ASCT: autologous stem cell transplantation; C: cycle; D: day; EOT: end of treatment; FU: follow-up; IFM: Intergroupe Francophone du Myelome; M: maintenance; PA: post-autograft; PreMob: premobilization; QLQ-C30: Quality of Life Questionnaire Core-30; QoL: quality of life; RVd: lenalidomide, bortezomib, and dexamethasone; SD: standard deviation. aEnd of induction is end of cycle 3/prior to PreMob; follow-up visit 1 is 2 years after initial dosing; follow-up visit 2 is 3 years after initial dosing. bGeneral population (N = 11,343). Mean global QoL value for general population is 65.5 (weighted score). Reference values for general population were used as a benchmark to help interpret findings [Citation19]. cGeneral population (N = 11,343). Mean value for general population is 84.9 (weighted score). dGeneral population (N = 11,343). Mean value for general population is 84.2 (weighted score).
![Figure 1. Mean observed scores for the QLQ-C30 domains in the IFM 2009 trial compared with the general population of: global QoL (a); physical functioning (b); and role functioning (c).a ASCT: autologous stem cell transplantation; C: cycle; D: day; EOT: end of treatment; FU: follow-up; IFM: Intergroupe Francophone du Myelome; M: maintenance; PA: post-autograft; PreMob: premobilization; QLQ-C30: Quality of Life Questionnaire Core-30; QoL: quality of life; RVd: lenalidomide, bortezomib, and dexamethasone; SD: standard deviation. aEnd of induction is end of cycle 3/prior to PreMob; follow-up visit 1 is 2 years after initial dosing; follow-up visit 2 is 3 years after initial dosing. bGeneral population (N = 11,343). Mean global QoL value for general population is 65.5 (weighted score). Reference values for general population were used as a benchmark to help interpret findings [Citation19]. cGeneral population (N = 11,343). Mean value for general population is 84.9 (weighted score). dGeneral population (N = 11,343). Mean value for general population is 84.2 (weighted score).](/cms/asset/32ff2a2d-23b8-4bd1-a927-2665c867c25a/ilal_a_1719091_f0001_c.jpg)
Table 3. MMRM analyses for LS mean changes from baseline in HRQoL.
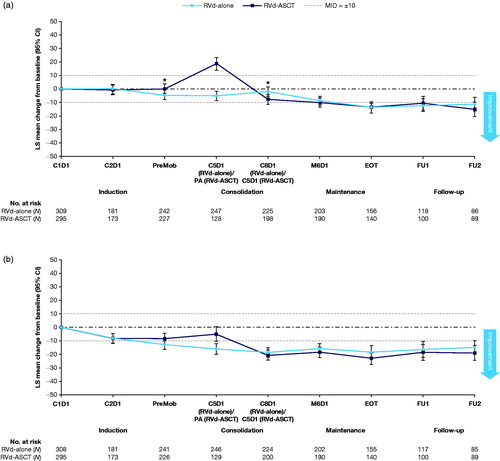
Figure 2. Mean changes from baseline in the IFM 2009 trial for: the fatigue domain of QLQ-C30 (a); and the pain domain of QLQ-C30 in the IFM 2009 trial (b).a ASCT: autologous stem cell transplantation; C: cycle; CI: confidence interval; D: day; FU: follow-up; IFM: Intergroupe Francophone du Myelome; LS: least squares; M: maintenance; MID: minimally important difference; PA: post-autograft; PreMob: premobilization; QLQ-C30: Quality of Life Questionnaire Core-30; RVd: lenalidomide, bortezomib, and dexamethasone. aEnd of induction is end of cycle 3/prior to PreMob; follow-up visit 1 is 2 years after initial dosing; follow-up visit 2 is 3 years after initial dosing. *Significance between the groups at p < .05 based on a two-sample t-test. A positive value indicates improvement from baseline and vice versa.
GLAL-2019-0996-File002.docx
Download MS Word (809.6 KB)Data availability statement
The datasets generated during and/or analyzed during the current study are available from the corresponding author on reasonable request.