Figures & data
Table 1. Clinical information at diagnosis, NGS at first relapse, MFC-MRD and MRD for NPM1 (ddPCR and qPCR) until the first relapse.
Figure 1. Performance of IBSAFE and comparison of IBSAFE and WES measured variant allele frequencies (VAFs) in diagnosis and relapse samples. (A) Dilution series for IBSAFE assay NPM1 type A for constructed samples with known VAFs at 10%, 1%, 0.1%, 0.01%, 0.001%, and 0%. (B) Scatterplot for agreement between the methods with Pearson’s coefficient of determination R2=0.77 and p-value <.0001, N = 144, (C) Bland Altman plot.
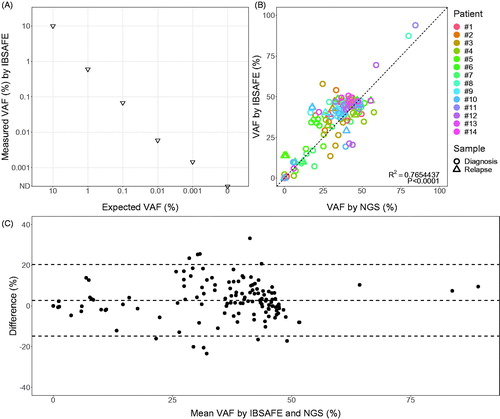
Table 2. Number of mutations at diagnosis and first relapse.
Figure 2. Monitoring leukemic mutations using ultrasensitive IBSAFE for ten relapsing AML patients (A) #4, (B) #9, (C) #6, (D) #8, (E) #7, (F) #5, (G) #1, (H) #3, (I) #10 and (J) #2. In each plot, the y-axis represents the detected variant allele frequency (VAF %) for each tracked mutation (key to the right; genes known to be recurrently mutated in AML in bold), and the x-axis indicates the days after diagnosis with therapies indicated by shading (chemotherapy) and clinical events indicated along the top of each plot. The inverted triangles indicate the flow cytometry MRD results, with the color-key indicated in the lower-right of plot (A). Dx: diagnosis; R: relapse; †: dead: SCT: stem cell transplantation; FU; follow-up; H: harvest; ND: not detected (VAF below lower effective limit of detection of 0.003% determined by input DNA quantity).
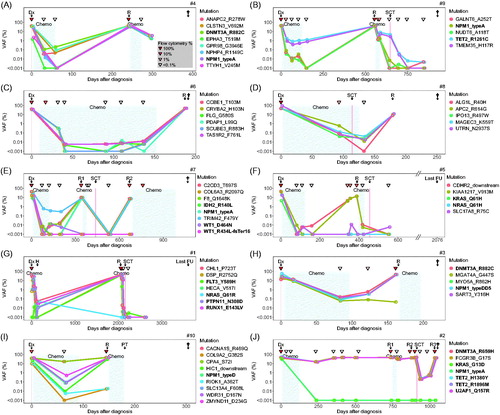
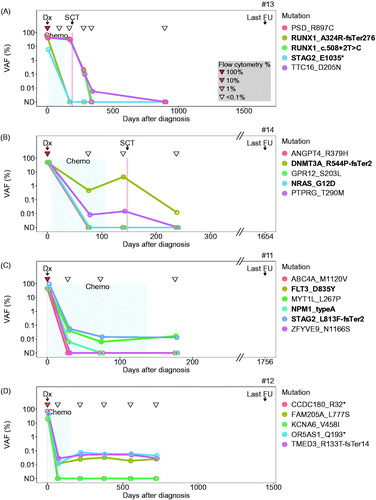
Figure 3. Monitoring leukemic mutations using ultrasensitive IBSAFE for four non-relapsing AML patients (A) #13, (B) #14, (C) #11 and (D) #12. In each plot, the y-axis represents the detected variant allele frequency (VAF %) for each tracked mutation (key to right; genes known to be recurrently mutated in AML in bold), and the x-axis indicates the days after diagnosis with therapies indicated by shading (chemotherapy) and clinical events indicated along the top of each plot. The inverted triangles indicate the flow cytometry MRD results, with the color-key indicated in the lower-right of plot (A). Dx: diagnosis; FU: follow-up; SCT: stem cell transplantation; ND: not detected (VAF below 0.003%).