
Figures & data
Table 1. Variables significantly associated with survival for all patients.
Table 2. Variables significantly associated with survival stratified by stem cell transplantation.
Figure 1. Survival characteristics of the SCT– (left panel) and SCT+ (right panel) patients. Upper row: K–M curves, bottom row: distribution of NR3C1 expression values. Quartiles Q1 and Q3 are marked as vertical lines.
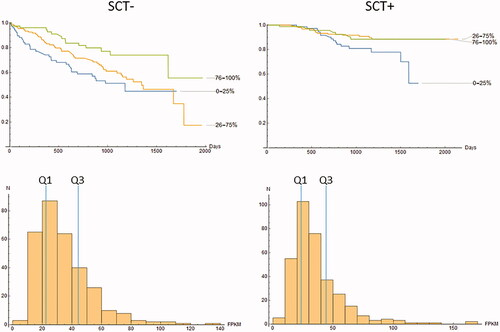
Figure 2. Effect of translocations t(14:20) and t(14:16) on NR3C1 expression for all patients.
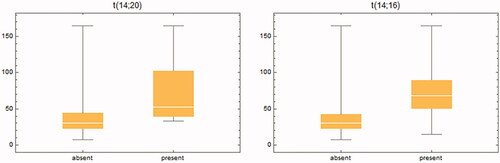
Table 3. Variables significantly associated NR3C1expression (linear model).