Figures & data
Table 1. Baseline demographic/clinical characteristics at multiple myeloma diagnosis.
Table 2. Number of patients in subgroups.
Figure 1. Multiple myeloma treatments over time. (A) Top regimens of multiple myeloma patients at line of therapy by treatment initiation year. The proportion of patients receiving different regimens is shown over time in 2-year increments from 2012 to 2019. Dex: dexamethasone; IMiD: immunomodulatory imide drug; MoAB: monoclonal antibody; PI: proteasome inhibitor. (B) Trends in line of therapy and regimen combinations by treatment initiation year. The proportion of patients receiving monotherapy, doublet, triplet, quad, or other regimens is shown over time in 2-year increments from 2012 to 2019.
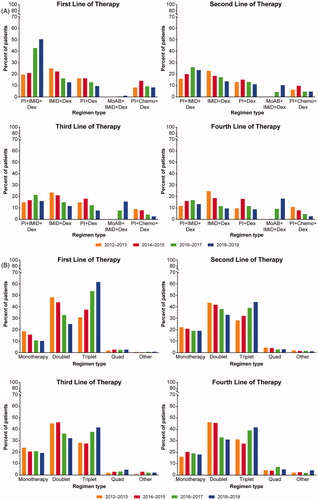
Figure 2. Multiple myeloma survival. (A) Trends in overall survival of multiple myeloma patients by line of therapy. Shown is survival by LOT 1 to LOT 5 for years 2011–2019. CI: confidence interval; LOT: line of therapy. (B) Trends in overall survival in frontline-treated multiple myeloma patients by year of diagnosis. Shown is survival for patients receiving first-line therapies by year of diagnosis, 2011–2012 or 2013–2014, i.e. for those years that had 5 years of follow-up data available, with the dotted line at the 5-year mark. CI: confidence interval.
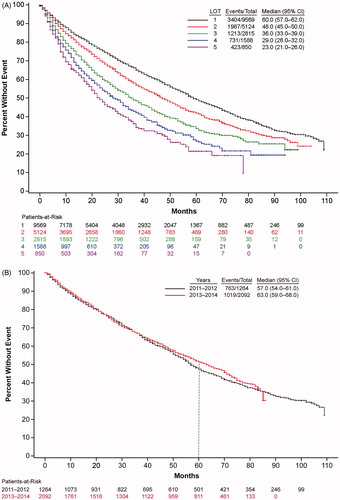
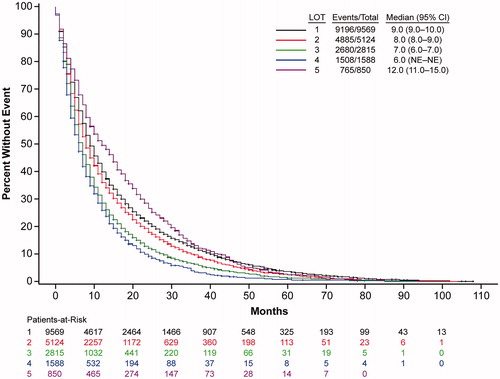
Figure 3. Trends in treatment duration of multiple myeloma patients by line of therapy. Shown is treatment duration by LOT for years 2011 to 2019. CI: confidence interval; LOT: line of therapy; NE: not estimable.