
Figures & data
Figure 1. Study design. aIncluded by amendment to the protocol. bPatients were treated for up to 24 months after the last patient’s first visit (December 23, 2014), unless discontinuation criteria were met. BID: twice daily; Int: intermediate; PET-MF: post-essential thrombocythemia myelofibrosis; PLT: platelet; PMF: primary myelofibrosis: PPV-MF: post-polycythemia vera myelofibrosis.
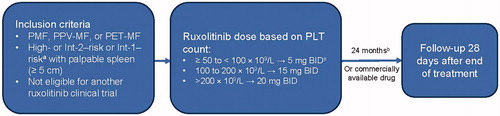
Table 1. Patient baseline characteristics.
Table 2. Comparison of baseline Hb levels and platelet counts with ruxolitinib dose at Week 12.
Figure 2. Factors predicting higher spleen response rates in multivariate analysis. ORs and the corresponding 95% CIs were derived by fitting a logistic regression with response as a binomial independent variable and the patient subgroups as binomial covariates. Factors associated with a higher spleen response rate are shown in bold font. Patient characteristics favored by the OR are labeled with a dot (•). BL: baseline; CI: confidence interval; DIPSS: Dynamic International Prognostic Scoring System; IPSS: International Prognostic Scoring System; LCM: left costal margin; MF: myelofibrosis; OR: odds ratio; WBC: white blood cell.
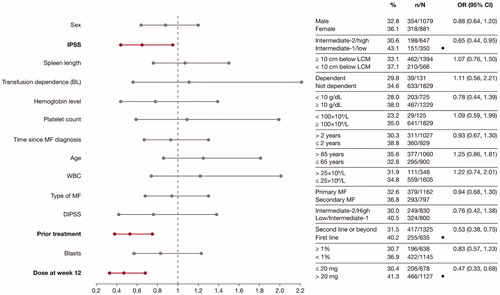
Figure 3. Factors predicting improvements in HRQoL and symptoms, assessed by improvements in FACT–Lym total score (A) and FACIT-F score (B) in multivariate analyses. ORs and the corresponding 95% CIs were derived by fitting a logistic regression with response as a binomial independent variable and the patient subgroups as binomial covariates. Factors associated with a higher spleen response rate are shown in bold font. Patient characteristics favored by the OR are labeled with a dot (•). BL: baseline; CI: confidence interval; DIPSS: Dynamic International Prognostic Scoring System; FACT-Lym: Functional Assessment of Cancer Therapy-Lymphoma; FACIT-F: Functional Assessment of Chronic Illness Therapy-Fatigue; HRQoL: health-related quality of life; IPSS: International Prognostic Scoring System; LCM: left costal margin; MF: myelofibrosis; OR: odds ratio; WBC: white blood cell.
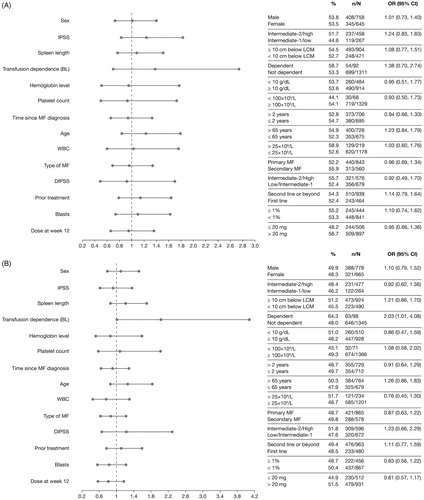
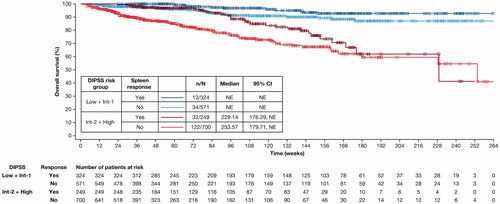
Figure 4. Kaplan–Meier estimate of overall survival of spleen responders vs non-responders at Week 24 stratified by DIPSS risk status. Spleen response was defined as having a non-palpable spleen at Week 24 (in patients with a palpable spleen 5–10 cm below the left costal margin at baseline) or a decrease in spleen length by ≥50% at Week 24 (in patients with a palpable spleen >10 cm at baseline). Patients with missing spleen data were considered non-responders. CI: confidence interval; DIPSS: Dynamic International Prognostic Scoring System; Int: intermediate; NE: not evaluable.
Data availability statement
Novartis is committed to sharing with qualified external researchers access to patient-level data and supporting clinical documents from eligible studies. These requests are reviewed and approved by an independent review panel on the basis of scientific merit. All data provided are anonymized to respect the privacy of patients who have participated in the trial, in line with applicable laws and regulations. This trial data availability is according to the criteria and process described on www.clinicalstudydatarequest.com.