
Figures & data
Figure 1. Expression of CD31 on CD19+/CD5+ lymphocytes in BM obtained from patients with newly diagnosed MCL; (A) % of CD31 + CD19 + CD5+ cells, median % = 57.25; (B) MFI of CD31 + CD19 + CD5+ cells, median MFI = 669.5; (C) MFI correlated with the percentage of positive cells (r = 0.8959, p < 0.0001).
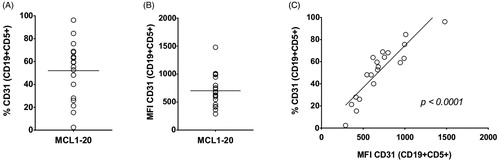
Table 1. Baseline characteristics of patients (MIPI = Mantle Cell Lymphoma International Prognostic Index, ND = not determined). BM infiltration and leukemisation was set by FCM.
Figure 2. Cell lines JEKO1 and MINO and their respective clones with transgenic expression of CD31: (A, B) Surface expression of CD31 (FCM) represented by dark gray histograms, light gray histograms show isotype control, (C, D) Comparison of in vitro proliferations.
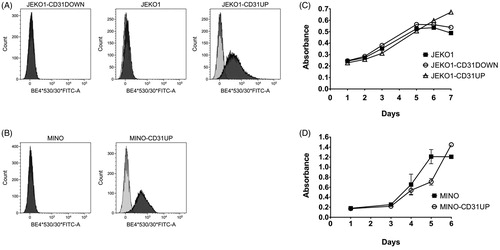
Figure 3. Tumor growth acceleration after SC xenotransplantation of CD31UP clones compared to original cell lines or CD31down clone displayed by tumor growth curves. (A) JEKO1, (B) MINO.
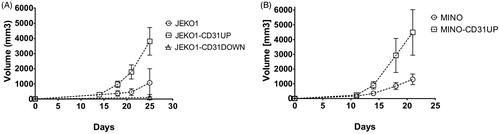
Figure 4. Survival curves of mice after IV xenotransplantation of different MCL clones with manipulated CD31 expression (A, C) and examples of E/E involvement: (B) stomach infiltration (left) by JEKO1-CD31UP cells compared to normal stomach from JEKO1 IV (right), (D) examples of E/E involvement appearing after MINO-CD31UP IV xenotransplant from left to right: infiltration of soft tissues, ovarium and kidney.
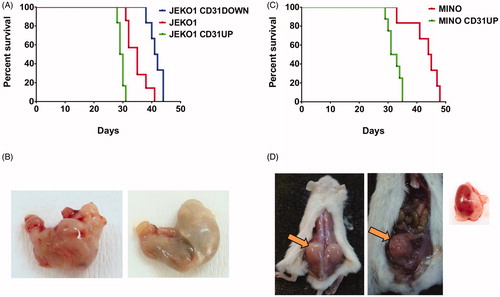
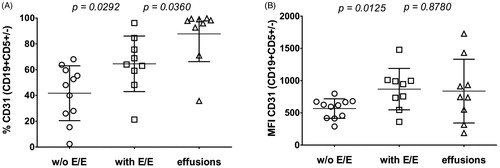
Figure 5. Comparison of CD31 positivity (A) and CD31 MFI (B) in MCL cells obtained from BM of patients w/o and with E/E involvement and MCL cells obtained from pleural effusions.