
Figures & data
Table 1. Patient characteristics.
Figure 1. Kaplan–Meier plots of the time to response in first line of treatment measured by involved free light chain (iFLC), serum protein electrophoresis (sPEP) and urine electrophoresis (uPEP). (A) Patients with IgG subtype. (B) Patients with IgA subtype.
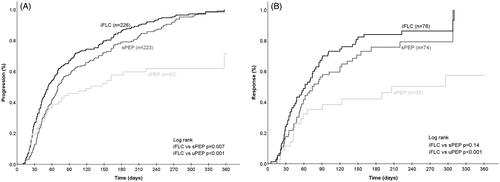
Table 2. Time to response (TTR), in months, in the 1st, 2nd, 3rd line of treatment and on all occasions of responses (in all 3 lines).
Figure 2. Time to first response measured by involved free light chain (iFLC), serum protein electrophoresis (sPEP) and urine electrophoresis (uPEP). (A) Measurable disease by sPEP only, i.e. >1 g/dl M-protein in serum and iFLC ≤ 10 mg/dl. (B) Measurable disease by sPEP and iFLC, i.e. >1 g/dl M-protein in serum and iFLC > 10 mg/dl. (C) Measurable disease by iFLC and uPEP only, ≤1 g/dl M-protein in serum and >200 mg/24 h M-protein in urine, and iFLC > 10 mg/dl).
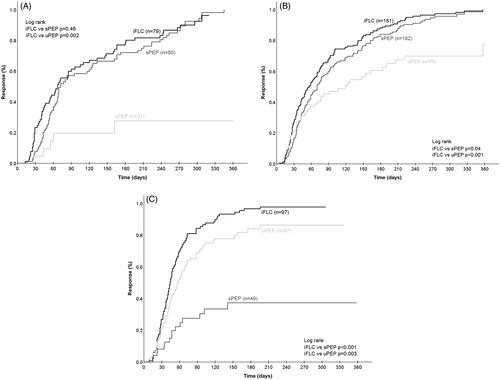
Table 3. Time to response, in months, in the first line of treatment grouped by measurable disease.
Table 4. Time to progression (TTP), in months, in the first, second, thirdof treatment and on all occasions of responses (in all three lines).
Figure 3. Time to first progression measured by involved free light chain (iFLC), serum protein electrophoresis (sPEP) and urine electrophoresis (uPEP). (A) Measurable disease by sPEP and iFLC, i.e. >1 g/dl M-protein in serum and iFLC > 10 mg/dl. (B) Measurable disease by sPEP only, i.e. >1 g/dl M-protein in serum and iFLC ≤ 10 mg/dl. (C) Measurable disease by iFLC and uPEP only, ≤1 g/dl M-protein in serum and >200 mg/24 h M-protein in urine, and iFLC > 10 mg/dl).
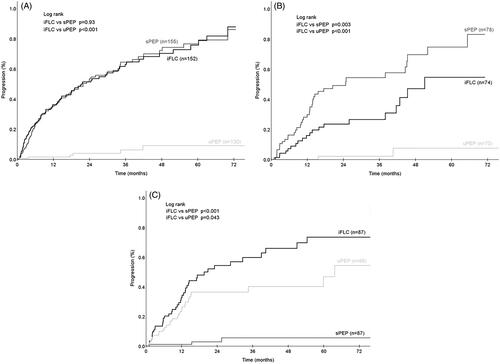
Table 5. Time to first-line progression, in months, grouped by measurable disease.