
Figures & data
Table 3. sgRNA sequences.
Figure 1. Idelalisib induced changes in the immunity crosstalk in stromal cells after CLL contact. EL08-1D2 cells were cocultivated with CLL cells for 5 d. Idelalisib (5 µM) was added 24 h prior separation of the cell types. The stromal cells were subjected to gene expression analyses focusing on the stromal immunity crosstalk (RT2Profiler PCR Array, Qiagen). (A) Scatter Blots from EL08-1D2 cells in monoculture ± Idelalisib and EL08-1D2 cells after coculture with CLL cells (SP) for 5 d with CLL cells from 3 individual patients ± Idelalisib were shown (n = 3). (B) The Volcano plot was calculated using the data derived from the scatter plots (https://geneglobe.qiagen.com/de/my-geneglobe/analysis). It displayed Idelalisib induced differentially expressed genes in EL08-1D2 stromal cells upon CLL contact (n = 3). Significant downregulated genes like C–C Motif Chemokine Receptor 9 (Ccr9/CD199), Tumor Necrosis Factor Ligand Superfamily Member 10 (Tnfsf10/Trail/CD253) and Colony Stimulating Factor 2 (Csf2/GM-CSF) were found within the upper left quadrant (blue box). (C) Concentration of the stromal GM-CSF was assessed in the supernatant from EL08-1D2 and HS-5 stromal cells before and after CLL contact using a species-specific GM-CSF ELISA (n = 6). (D) Density of stromal CD199 and (E) CD253 was detected on EL08-1D2 and HS-5 cells upon CLL contact under baseline conditions and after Idelalisib treatment by FACS analysis (n = 6). Bars indicate the standard error of the mean. *p < 0.05; **p < 0.01; ***p < 0.001. Abbreviations: CLL: chronic lymphocytic leukemia cells; SP: stromal cell pellet after CLL contact; Ctrl: control CLL cells with stromal contact without treatment; p; p-value.
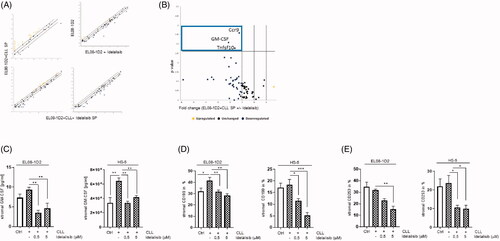
Figure 2. Notch signaling in stromal cells after CLL contact is not affected by Idelalisib treatment. (A) Apoptotic CLL cells were cultured on EL08-1D2 and HS-5 stromal cells under baseline conditions or after addition of Idelalisib (5 µM, 24 h) or DAPT (10 µM, 4 d) or combination of both. CLL cells were assessed by Annexin-V/PI staining (n = 7). (B) EL08-1D2 and (C) HS-5 cells were cocultivated with CLL cells for 5 d under basal conditions. Idelalisib (5 µM, 24 h) or DAPT (10 µM, 4 d) or combination of both was added. After separation changes in the relative gene expression of the stromal Notch receptors Notch1, Notch2 and the transcription factor Hes1 were analyzed by qPCR in stromal cells (n = 6) (grey columns). The results were normalized to monocultured EL08-1D2 or HS-5 cells as control (white column). Bars indicate the standard error of the mean. ns (not significant); *p < 0.05; **p < 0.01; ****p < 0.0001. Abbreviations: CLL: chronic lymphocytic leukemia cells; DAPT: N-[N-(3,5-Difluorophenacetyl)-L-alanyl]-S-phenylglycine t-butyl ester; p: p-value.
![Figure 2. Notch signaling in stromal cells after CLL contact is not affected by Idelalisib treatment. (A) Apoptotic CLL cells were cultured on EL08-1D2 and HS-5 stromal cells under baseline conditions or after addition of Idelalisib (5 µM, 24 h) or DAPT (10 µM, 4 d) or combination of both. CLL cells were assessed by Annexin-V/PI staining (n = 7). (B) EL08-1D2 and (C) HS-5 cells were cocultivated with CLL cells for 5 d under basal conditions. Idelalisib (5 µM, 24 h) or DAPT (10 µM, 4 d) or combination of both was added. After separation changes in the relative gene expression of the stromal Notch receptors Notch1, Notch2 and the transcription factor Hes1 were analyzed by qPCR in stromal cells (n = 6) (grey columns). The results were normalized to monocultured EL08-1D2 or HS-5 cells as control (white column). Bars indicate the standard error of the mean. ns (not significant); *p < 0.05; **p < 0.01; ****p < 0.0001. Abbreviations: CLL: chronic lymphocytic leukemia cells; DAPT: N-[N-(3,5-Difluorophenacetyl)-L-alanyl]-S-phenylglycine t-butyl ester; p: p-value.](/cms/asset/b635fc33-8c4b-476b-96e9-225902fd3b99/ilal_a_1927019_f0002_c.jpg)
Figure 3. PKCβ inhibitor Enzastaurin support the Idelalisib-induced CLL cell death despite stromal contact. (A) Stromal PKCβ expression was assessed in EL08-1D2 cells (left panel) (n = 9) and HS-5 cells (right panel) (n = 8) before (Ctrl; white column) and after CLL contact (grey column) under baseline conditions and after addition of Idelalisib (0,5µM, 5 µM, 24 h) by FACS analysis. (B) CLL cells were cultured in medium as control (Ctrl) and were exposed to Idelalisib (5 µM) alone or in combination with Sotrastaurin (5 µM) or Enzastaurin (5 µM) for 24 h. Apoptotic CLL cells were stained with Annexin-V/PI (n = 6). (C) CLL cells were cultured in contact to EL08-1D2 and HS-5 stromal cells for 5 d (Ctrl). The cocultures were treated with Idelalisib (5 µM) or in combination with Sotrastaurin (5 µM) or Enzastaurin (5 µM) for 24 h. Annexin-V/PI staining detected CLL viability by FACS analysis (n = 6). (D) Stromal PKCβ expression was assessed in EL08-1D2 (left panel) and HS-5 cells (right panel) after CLL contact under baseline conditions and after addition of Sotrastaurin (5 µM) or Enzastaurin (5 µM) for 24 h by FACS analysis (n = 8). Bars indicate the standard error of the mean *p < 0.05; **p < 0.01; ***p < 0.001; ****p < 0.0001. Abbreviations: CLL: chronic lymphocytic leukemia cells; Ctrl: control CLL cells with stromal contact without treatment; APC: Allophycocyanin; p: p-value.
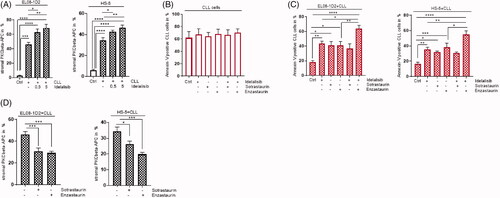
Figure 4. The Idelalisib-induced NF-κB activation in stromal cells in response to CLL contact is Notch2 dependent. (A) CLL cells were pretreated with the caspase inhibitor Z.vad.fmk (100 nM, 30 min) and cultured on EL08-1D2 and (B) HS-5 stromal cells for 5 d with and without Idelalisib treatment (5 µM, 24 h). After separation with CD19 beads the nuclear fractions of the stromal cells were isolated. The activation of the NF-κB transcription factor p50 and p65 in stromal was quantified using a colorimetric ELISA (OD450 nm). Stromal cells without CLL contact were designate as control (Ctrl; white column) (n = 6). (C) Notch2 was deleted in EL08-1D2 (EL08ΔNotch2) and HS-5 (HS-5ΔNotch2) cells using CRISPR/Cas9 technology. Exemplary histogram of Notch2 in EL08-1D2 cells (Ctrl) and EL08-1D2ΔNotch2 is shown (left panel). Flow cytometry of stromal Notch2 expression on the cell surface of EL08-1D2 and HS-5 cells ± CRISPR/Cas9 deletion of Notch2 was detected (n = 3). (D) NF-κB transcription factor p50 and p65 expression in EL08ΔNotch2 and (E) HS-5ΔNotch2 stromal cells was quantified using a colorimetric ELISA. Notch2-deleted stromal cells without CLL contact were designate as control (Ctrl; white column) (n = 6). Bars indicate the standard error of the mean. *p < 0.05; **p < 0.01; ***p < 0.001; ****p < 0.0001. Abbreviations: CLL: chronic lymphocytic leukemia cells; Ctrl: control CLL cells with stromal contact without treatment; EL08ΔNotch2: Notch2 deleted EL08-1D2 cells via CRISPR/Cas9; APC: Allophycocyanin; p: p-value.
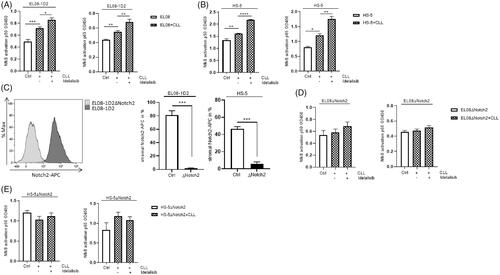
Figure 5. Idelalisib treatment combined with PKCβ inhibition can overcome stromal-mediated drug resistance in 3D cell culture. Apoptotic CLL cells were quantified by Annexin-V/PI staining after contact to EL08-1D2 and HS-5 cells (Ctrl) for 5 d with 24 h exposure to (A) Idelalisib (5 µM) ± ABT-199 (10 nM) (B) Idelalisib (5 µM) ± Fludarabine (40 µg/ml), (C) Idelalisib (5 µM) ± Ibrutinib (10 µM) in a standard 2D cell culture (n = 6). (D) Illustration of the scaffold-based 3D-model consisting of stromal cells and malignant B-cells with the core region and the peripheral regions. (E) CLL cell survival was measured using Annexin-V/PI staining after coculture in 3D cell culture conditions and 24 h inhibitor exposure to Idelalisib (5 µM) ± Enzastaurin (5 µM), ± ABT-199 (10 nM), ± Fludarabine (40 µg/ml) and ± Ibrutinib (10 µM). CLL cells were in direct contact to stromal cells (EL08-1D2, left panel; HS-5, right panel) and isolated from the peripheral regions of the scaffold (n = 6). (F) Using confocal laser microscopy, the distribution of the stromal cells in the different regions of the scaffold was determined. Serial sections EL08-1D2 (left panel) and HS-5 stromal cells (right panel) in coculture with CLL cells were stained for CD19 (red) and CellMask plasma membrane stain (green). Nuclei were stained with DAPI (blue) (n = 3). Scale bars: 100 μm. Z-stacks of stained 3D cultures were imaged by a confocal spinning disk microscope with an axial distance of 270 nm and reconstructed for 3D visualization. (G) CLL cell survival was measured using Annexin-V/PI staining after coculture in 3D cell culture conditions and 24 h inhibitor exposure to Idelalisib (5 µM) ± Enzastaurin (5 µM), ± ABT-199 (10 nM), ± Fludarabine (40 µg/ml) and ± Ibrutinib (10 µM). CLL cells were isolated after 5 d of coculture in direct contact to stromal cells (EL08-1D2, left panel; HS-5, right panel) from the core region of the scaffold (n = 6). Bars indicate the standard error of the mean. *p < 0.05; **p < 0.01; ***p < 0.001; ****p < 0.0001. Abbreviations: CLL: chronic lymphocytic leukemia cells; Ctrl: control CLL cells with stromal contact without treatment; p: p-value.
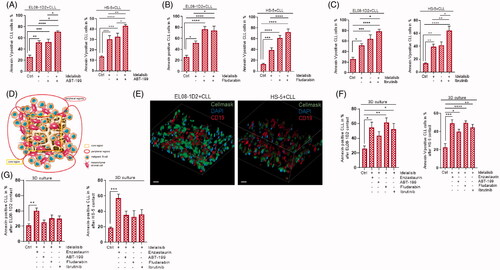
Table 1. Antibody list.
Table 2: Primer.