Figures & data
Figure 1. Overview of genomic alterations identified in the cohort. (A) Distribution of variant classification in the cohort. (B) Distribution of the single-nucleotide variants (SNVs) in the cohort.
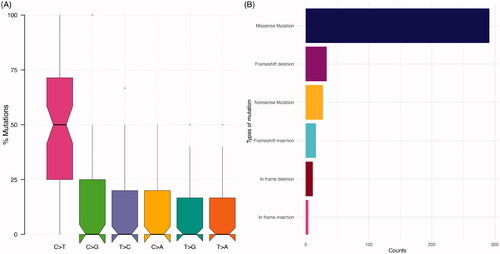
Figure 2. Landscape of mutations in the BLISS cohort. Oncoplot of the most commonly altered genes in the cohort. The upper bar plot represents counts of alterations per sample. The right panel bar plot refers to the total number of samples with alterations in that specific gene. Clinicopathological information is added on the lower region of the oncoplot.
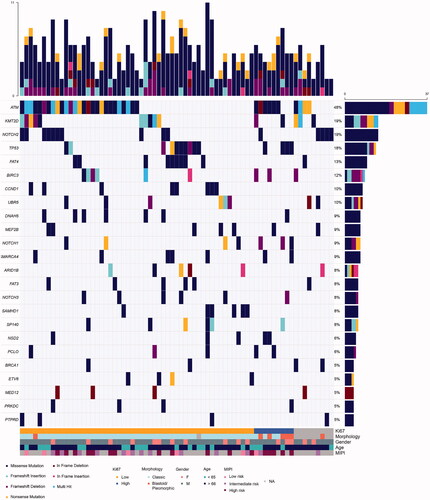
Figure 3. Recurrent mutations identified in the MEF2B gene. Identified in the image are the recurrent mutations K23R and N49S. The myocyte enhancer factor-2 binding domain is represented in orange in the plot.
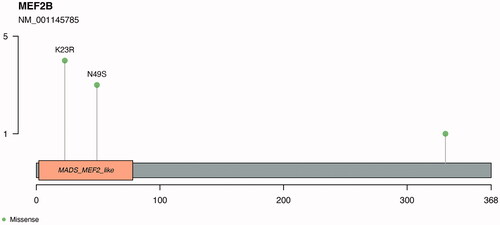
Figure 4. Pathways and biological processes that were affected by mutations. The most commonly mutated pathways included cell cycle and TP53.
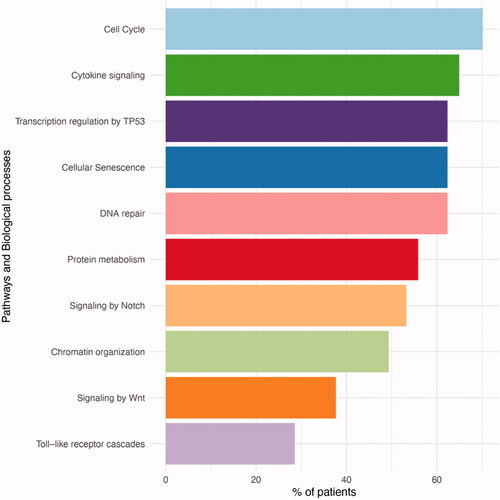
Figure 5. Prediction of driver genes in MCL. (A) Prediction of driver properties in recurrently altered genes. Known drivers refer to genes that have been functionally proven to drive cancer cells. Predicted drivers are genes that are hypothesized to drive cancer. Predicted passengers are mutations in genes without known driver role in carcinogenesis. Information gathered from the CGI analysis. Genes with alterations in at least four patients are shown grouped by their predicted driver properties. (B) E571K XPO1 mutations localization. IBN_N: Improtin-beta N-terminal domain; XPO1: exportin 1-like protein; CRM1: Chromosomal regional maintenance 1; CRM1_C: CRM1 C-terminal.
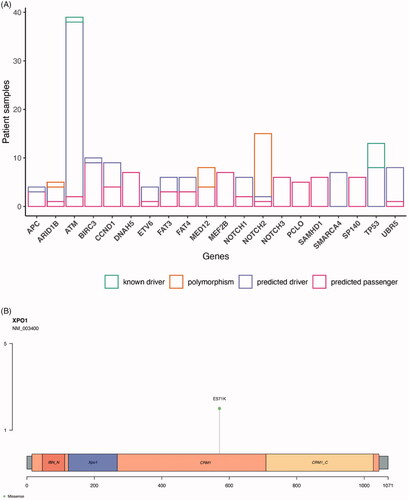
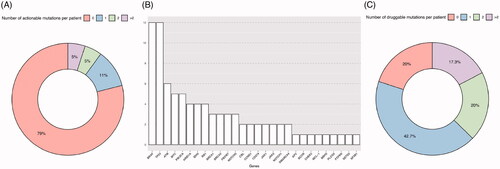
Figure 6. Target approach identifies mutations with potential impact on clinical decision making. (A) Number of actionable mutations in the cohort per patient sample addressed today by OncoKB platform, which provides information according to established guidelines. (B) Genes with druggable mutations and the number of drugs (y axis) for which they predict response according to literature. (C) Number of druggable mutations in the cohort per patient sample according to CGI database, that includes future addressable mutations according to scientific publication of both clinical and pre-clinical studies.