
Figures & data
Table 1. Classification of immediate prior systemic therapies in the MAVORIC trial for subgroup analyses.
Table 2. Baseline disease stage and median PFS, confirmed ORR, and median DOR after mogamulizumab treatment by number of prior systemic therapies in patients randomized to mogamulizumab (ITT population).
Figure 1. (A) Confirmed global ORR, (B) median PFS, and (C) DOR to mogamulizumab by immediate prior systemic therapy and prior HDAC inhibitor exposure (ITT population). CR: complete response; DOR: duration of response; ECP: extracorporeal photopheresis; HDAC: histone deacetylase; ORR: overall global response rate; PFS: progression-free survival; PR: partial response.
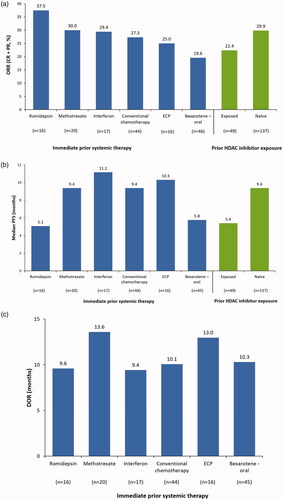
Table 3. Baseline characteristics and outcomes by immediate prior therapy class in patients randomized to mogamulizumab (ITT population).
Table 4. Effect of immune activity of immediate prior systemic therapy on PFS and confirmed ORR with mogamulizumab.