
Figures & data
Figure 1. PRISMA flowchart of search results. DEF: data extraction form; WoS: Web of Science.
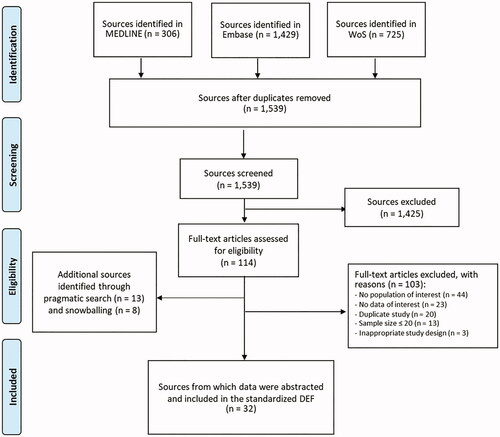
Table 1. Characteristics of studies included in the systematic review on the effectiveness and safety of BV in R/R cHL patients (N = 32).
Table 2. Patient characteristics in studies included in the systematic review on the effectiveness and safety of BV in R/R cHL patients (N = 32).
Figure 2. Meta-analysis of overall response rates. (A) Forest plot of estimates of overall response rates after 4 cycles of treatment with BV (1st subgroup); (B) forest plot of estimates of overall response rates after 4–6 cycles of treatment with BV (2nd subgroup); (C) forest plot of estimates of overall response rates after 6 or more cycles of treatment with BV (3rd subgroup); (D) funnel plot of full-text publications reporting overall response rate estimates (n = 12 publications).
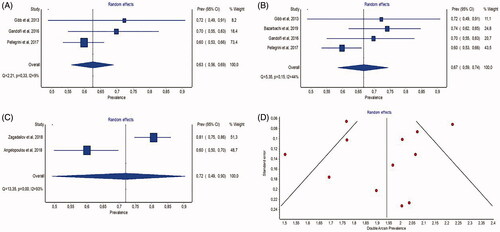
Figure 3. Meta-analysis of complete response rates. (A) Forest plot of estimates of complete response after 4 cycles of treatment with BV (1st subgroup); (B) forest plot of estimates of complete response after 4–6 cycles of treatment with BV (2nd subgroup); (C) forest plot of estimates of complete response after 6 or more cycles of treatment with BV (3rd subgroup); (D) funnel plot of full-text publications reporting complete response estimates (n = 12 publications).
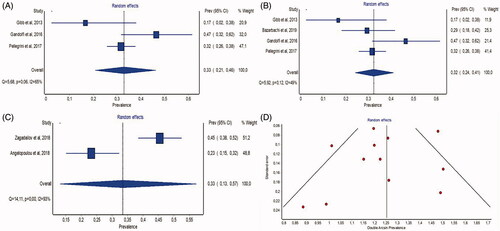
Table 3. Pooled estimates of complete response.
Table 4. Sensitivity analysis of pooled estimates of complete response.