Figures & data
Figure 1. (A) Distribution of WHO subentities of MDS and AML. (B) Spectrum of 64 TP53 disruptions among 40 patients with TP53-aberrant MDS/AML. (C) Cytogenetic landscape of TP53-aberrant myeloid neoplasm. Structural aberrations are shown in the chromomap. (D) Observed vs. expected burden of chromosomal aberrations per patient per gigabase of the genome, based on the size of reference human genome. Aberrations per gigabase are enumerated for each chromosome. AML-MRC: AML with myelodysplasia-related changes; t-AML: therapy-related AML; NOS: not otherwise specified; t-MDS: therapy-related MDS; MDS-EB-1: MDS with excess blasts-1 (5–9% blasts); MDS-EB-2: MDS with excess blasts-2 (10–19% blasts); MDS-SLD: MDS with single lineage dysplasia; MDS-MLD: MDS with multilineage dysplasia.
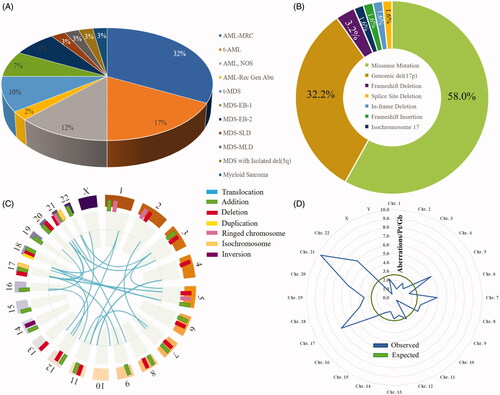
Table 1. Demographics and baseline disease features.
Figure 2. (A) Mutational hotspots on the TP53 gene. The x-axis represents the p53 isoform A amino acid sequence. The flags indicate TP53 gene mutations in the cohort. Each flag is detailed with the corresponding patient ID and gene mutation, and ID numbers with a ‘-2’ or ‘-3’ specify the second or third TP53 mutation, respectively, in a patient. Flag masts are coded by ‘best clinical response’ and ‘duration of best clinical response,’ represented by line color and line length, respectively. Flag heads are color-coded by ‘clinical outcome.’ (B) Catalogue of Somatic Mutations in Cancer (COSMIC) data for 2659 known TP53 mutations in hematolymphoid malignancies annotated against UMass cohort mutations in panel (A). (C) p53 isoform A with mutational hotspots primarily in the DNA-binding domain, with the majority between N235 and E286. (D) DNA-binding domain of p53 with mutational sites (red rectangles) from the UMass cohort. Structure has been adapted from prior studies [Citation25].
![Figure 2. (A) Mutational hotspots on the TP53 gene. The x-axis represents the p53 isoform A amino acid sequence. The flags indicate TP53 gene mutations in the cohort. Each flag is detailed with the corresponding patient ID and gene mutation, and ID numbers with a ‘-2’ or ‘-3’ specify the second or third TP53 mutation, respectively, in a patient. Flag masts are coded by ‘best clinical response’ and ‘duration of best clinical response,’ represented by line color and line length, respectively. Flag heads are color-coded by ‘clinical outcome.’ (B) Catalogue of Somatic Mutations in Cancer (COSMIC) data for 2659 known TP53 mutations in hematolymphoid malignancies annotated against UMass cohort mutations in panel (A). (C) p53 isoform A with mutational hotspots primarily in the DNA-binding domain, with the majority between N235 and E286. (D) DNA-binding domain of p53 with mutational sites (red rectangles) from the UMass cohort. Structure has been adapted from prior studies [Citation25].](/cms/asset/12a2470d-e422-4ec1-b196-c6b6052b8ec0/ilal_a_1957869_f0002_c.jpg)
Figure 3. (A) Frequency of co-occurring mutations with TP53-aberrrant MDS/AML in the UMass cohort. Genes are grouped and color-coded by cluster. The chord width between two genes corresponds to the rate of co-mutation. Genes were examined pairwise, moving clockwise around the circos. (B) Co-mutation frequency for TP53 chords only. (C) Rates of co-mutation with TP53 by gene cluster. (D) Co-mutational spectrum for 86 patients with TP53 mutations derived from aggregate analysis of 878 total AML samples from the cBioPortal platform. TP53 mutations were found in 86 samples by genome sequencing (mRNA ± whole exome). Samples harboring co-mutations in these candidate genes are shown by vertical columns. (E) Frequency of co-occurring mutations in the TP53-mutant UMass cohort (n = 40) vs. TP53-mutant cBioPortal cohort (n = 86) vs. cBioPortal total cohort (n = 878). *p < 0.05 for observed vs. expected.
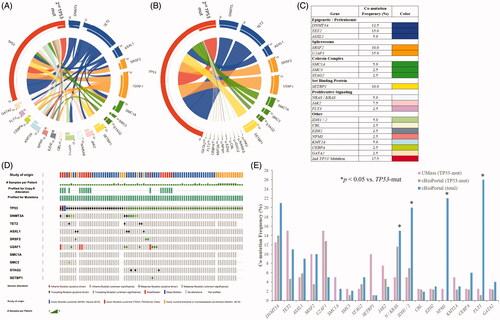
Figure 4. Subclonal architecture of TP53-mutant MDS/AML as determined by clonal dynamic modeling, organized by gene cluster. Clonal dynamics of TP53 and co-occurring mutant cell populations (with absolute or relative VAFs) are demonstrated by expansion and evolution over time and in relation to treatment. Relationship charts were constructed using timepoints when bone marrow sampling and molecular testing including CNV were performed. Timepoints are named in relation to the clinical disease context, for example at diagnosis (Dx), post-induction (Post-Ind), relapse (Rel), and after hematopoietic cell transplant (Post-HCT). (A) Patients with TP53 mutations only. (B) Dynamics of spliceosome-mutant descendants. (C) Dynamics of epigenetic regulator-mutant descendants. (D) Dynamics of cohesin complex-mutant descendants. (E) Dynamics of proliferative signaling-mutant descendants. Clonal phylogeny trees show hierarchical development of cell populations.
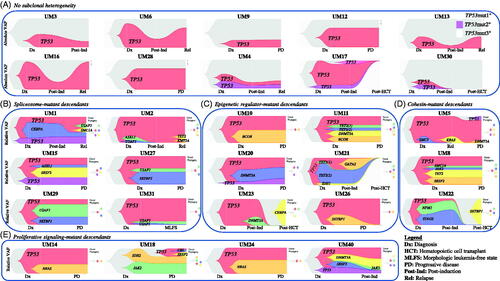
Figure 5. Relation between mutant TP53 VAF and multiple clinico-pathologic parameters, including (A) remission status, (B) durability of remission, (C) number of distinct cytogenetic aberrations at diagnosis, (D) number of co-occurring mutations at diagnosis, (E) bone marrow cellularity, and (F) bone marrow blast count. (G) Hierarchical clustering based on VAFs of co-occurring mutations. CR: complete remission; CRi: complete remission with incomplete count recovery; mo: months; y: years; BM: bone marrow; PB: peripheral blood; VAF: variant allele frequency.
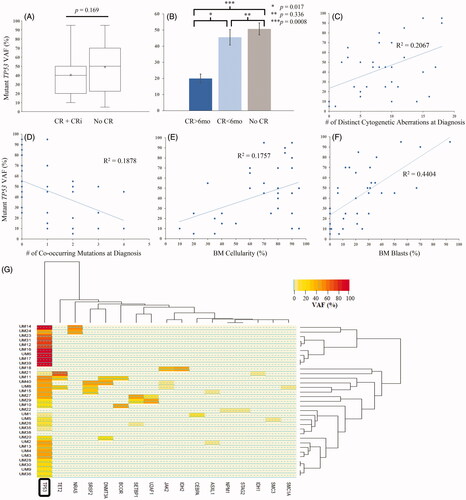
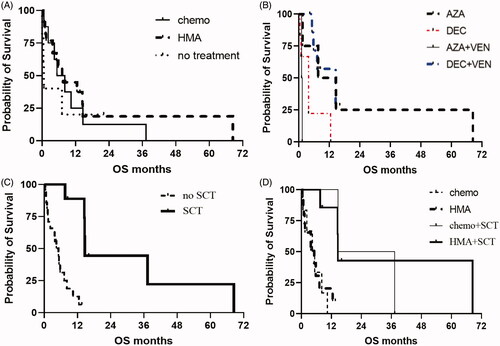
Table 2. Treatment response for patients who received HMA-based induction vs. cytotoxic chemotherapy-based induction.
Figure 6. (A) OS for patients after HMA-based induction vs. cytotoxic chemotherapy-based induction. (B) OS for patients stratified by type of HMA, with or without venetoclax. (C) OS for patients having received stem cell transplant compared to not having receiving stem cell transplant. (D) OS for patients stratified by type of first-line therapy and whether transplant was performed. HMA: hypomethylating agent; AZA: azacitidine; DEC: decitabine; SCT: stem cell transplant.